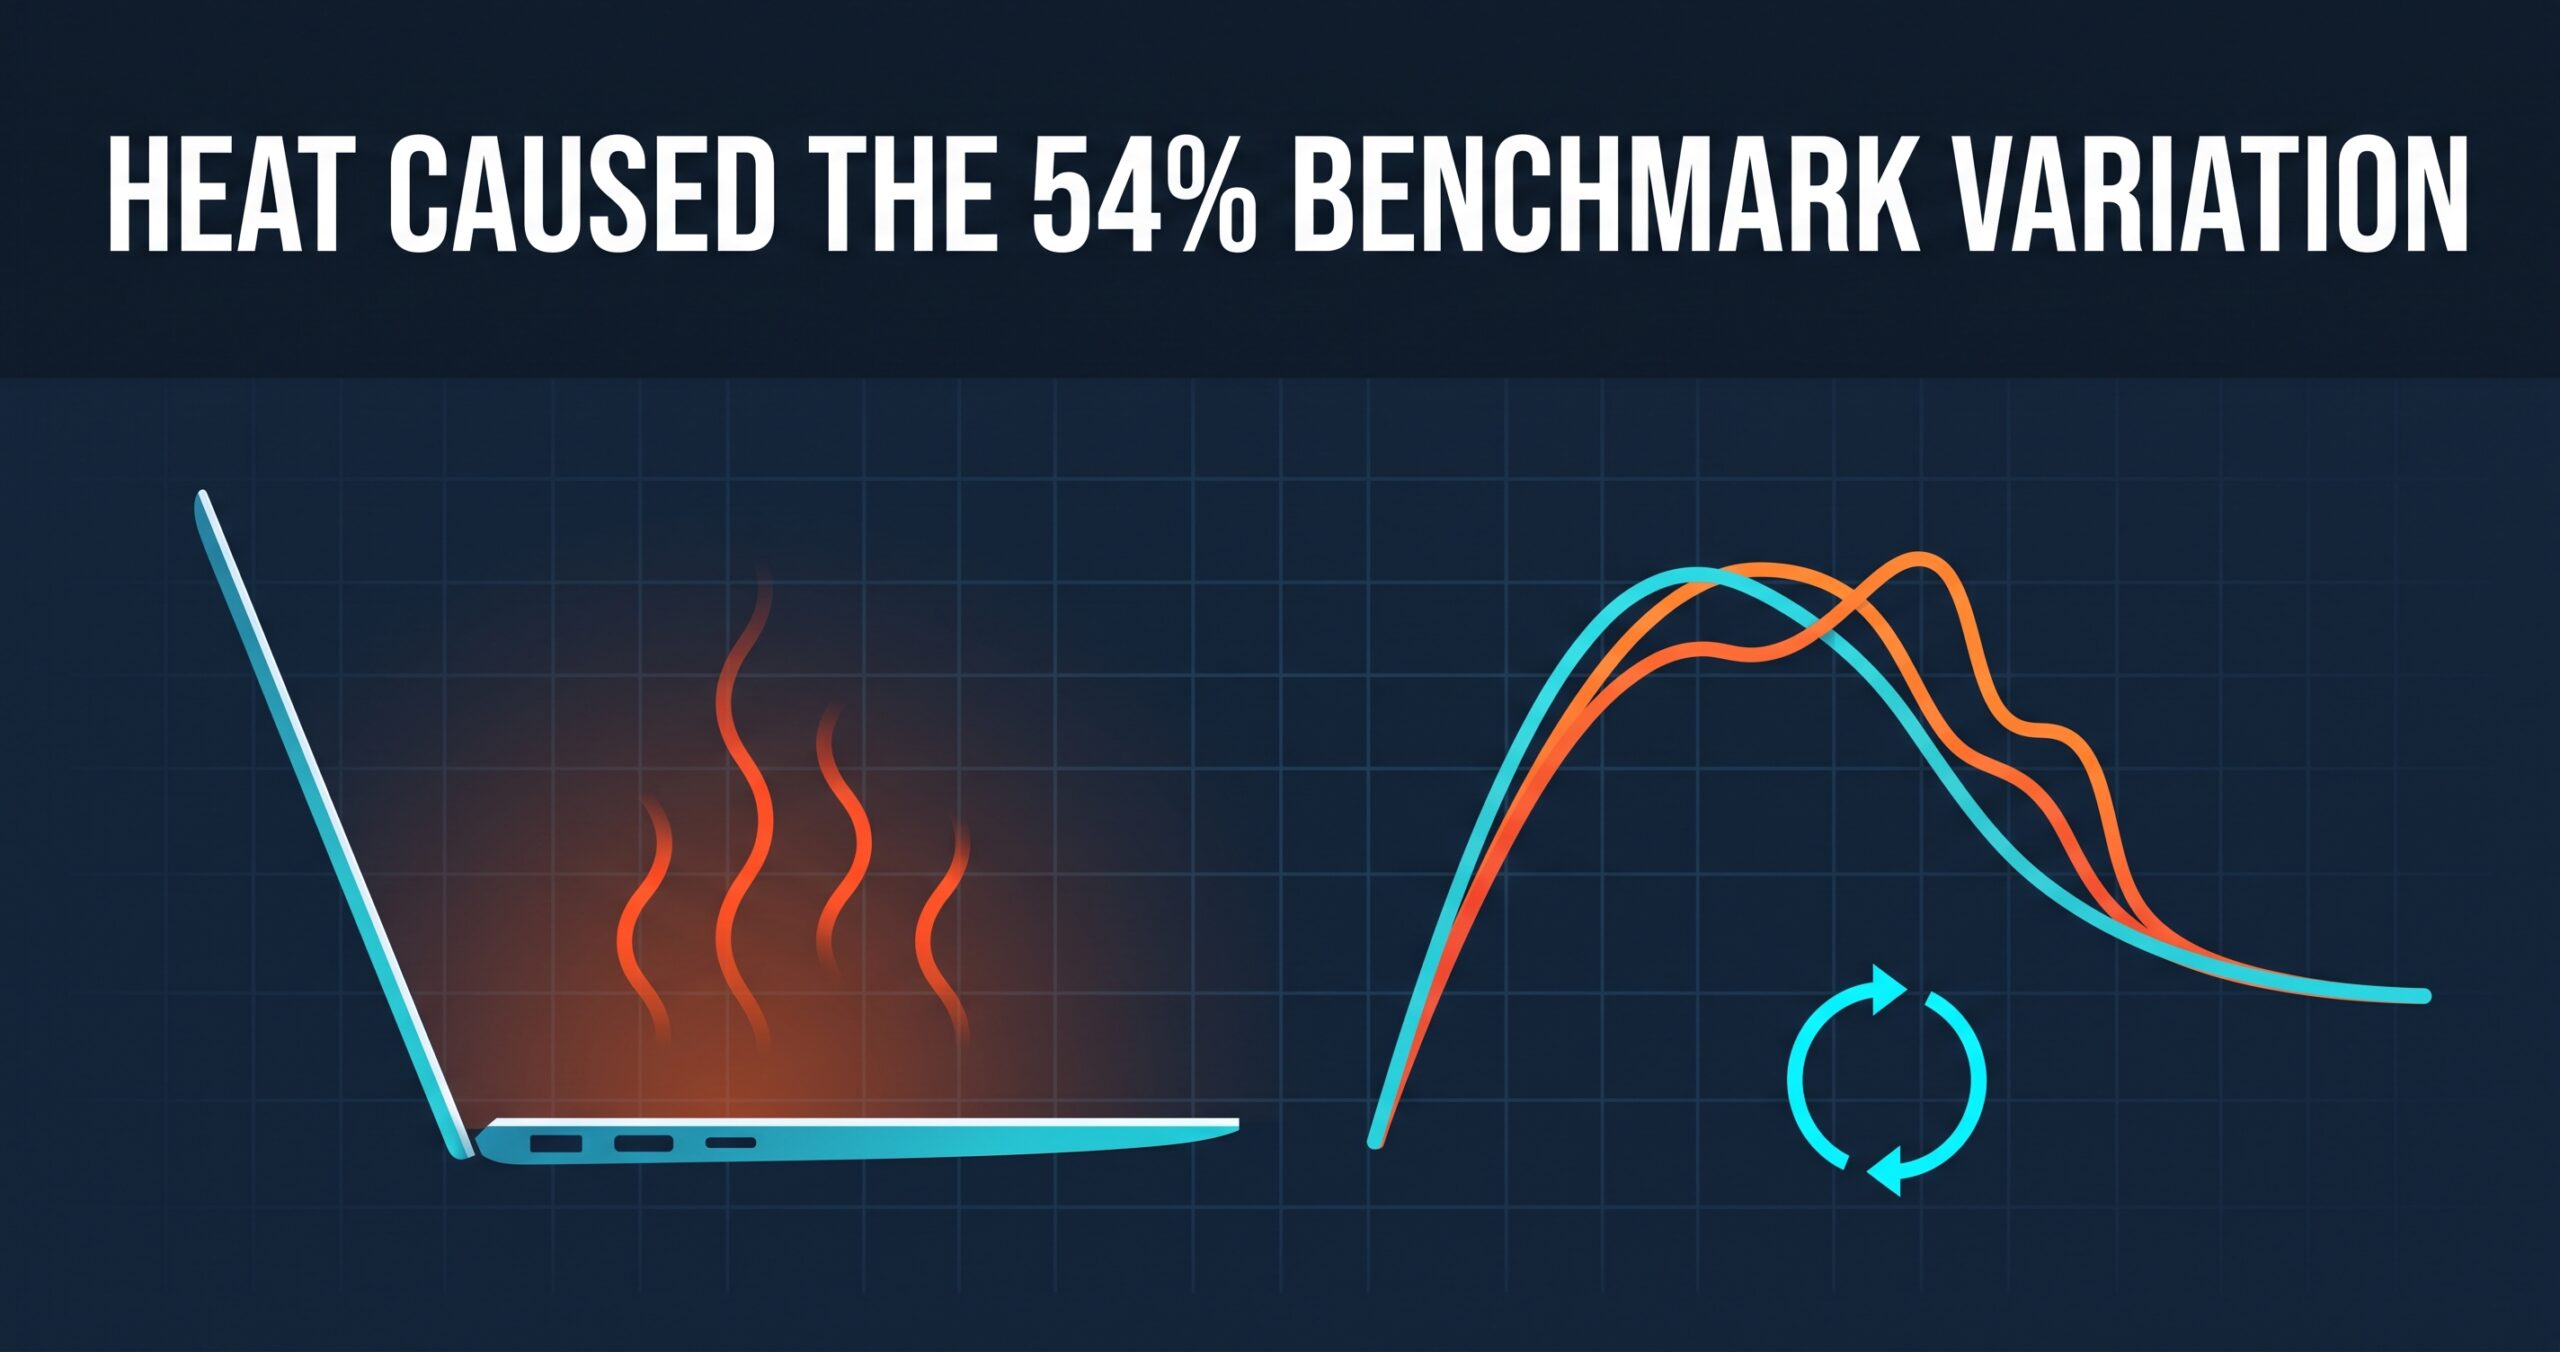
While measuring how my search engine scales with thread count (results here), I threw away my entire first data set. Here’s why — and if you ever benchmark anything on a fanless laptop, this is not someone else’s problem.
The first data set was clean, and wrong
I measured 1 through 10 threads, in order. The curve looked beautiful, including a shiny record: “11 threads, fastest at 5.2 seconds.” Right before writing the article, I re-ran the same conditions as a sanity check.
The same conditions came back up to 54% different. 4 threads: 11.0s became 9.0s. 11 threads: 5.2s became 8.0s. The record run did not reproduce.
No rogue background process. The culprit was the chassis.
The culprit: thermal history on a fanless machine
The test machine is a MacBook Air (Apple M4) — fanless. Under sustained load it heats up and thermal-throttles. Which means: every measurement depends on what you measured just before it.
The nasty part is that this is not random noise — it’s a systematic error. Sweep 1→2→…→10 in order and the later thread counts always run on a hotter chip. The high-thread results are penalized, consistently, in the same direction. Averaging repeated sweeps doesn’t remove it, because the bias repeats too. That “fastest 5.2s at 11 threads”? A single lucky run on a cold chip. The cleaner the graph, the more suspicious you should be.
The fix: round-robin
Stop measuring each thread count in a block. Instead: sweep 1-16 threads once, repeat the whole sweep for 4 rounds, and take the per-thread-count median across rounds. Every thread count now experiences cold and hot states equally; thermal history no longer piles onto specific configurations.
[Update, Aug 29, 2026] Being precise about “experiences cold and hot equally”
The sentence above is only true at the round level. Within a sweep it does not hold.
Re-reading the results CSV (
results_threads16_rr.csv, 128 rows) shows that all four rounds swept 1→16 in ascending order. Nothing was randomized, and the direction was never alternated. So within a single sweep, the higher thread counts are still measured on a hotter chip. That bias remains.Round totals for the search term “Tokyo”:
Round Total round1 127.1 s round2 155.1 s round3 152.4 s round4 161.7 s Only the first sweep runs on a cold machine. The round-to-round spread is 1% at 1 thread, 55% at 8 threads, and 56% at 13 threads — the heavier the load, the more heat shows up.
So what round-robin plus median actually achieved is these three things:
- It stopped block-measuring one configuration at a time (no single configuration builds up its own heat).
- Every thread count now gets the cold first round and the hot fourth round exactly once.
- The median (with 4 points, the mean of the middle two) drops both the coldest and the hottest value.
The ascending-order bias inside each sweep is still there. Removing it would require alternating the sweep direction per round, or randomizing the order outright. The next run will do that.
The article’s conclusion — a plateau at 8 threads, 3.0x over a single thread, thread count decided automatically — is unchanged.
The corrected protocol (128 measurements) produced the companion article’s conclusion: a plateau at 8 threads, 3.0x. The 5.2s ghost vanished; 7.4s became a reproducible floor.
How do you know the fix worked?
Claiming “the new numbers are right” needs evidence. Mine: two search patterns with hit counts differing by more than an order of magnitude (10,967 vs. 722 hits) produced nearly identical scaling curves.
[Update, Aug 29, 2026] How strong is that evidence, really
This paragraph originally ended with “if heat or any other disturbance were still leaking in, there’s no reason two independent series would line up that well.” That was overstated. Both series were measured inside the same sweeps, under the same thermal history — so if both are skewed in the same direction, they can line up while still being skewed. What this actually establishes is that the re-run is reproducible, not that the disturbance is gone.
I kept the first CSV for reference but decided it never appears in an article. Publish a retracted number “for reference” and someday someone will cite it.
Lessons
- On a fanless machine, measurement order leaks into results. A sequential sweep systematically penalizes the later configurations
- Distrust beautiful single records. One cold run masquerades as a best case
- Round-robin + median distributes cold and hot fairly across all configurations
- Validate with independent series, not repetition. Re-running the same biased protocol reproduces the same bias
The benchmark’s enemy wasn’t a rival product. It was my own chassis.
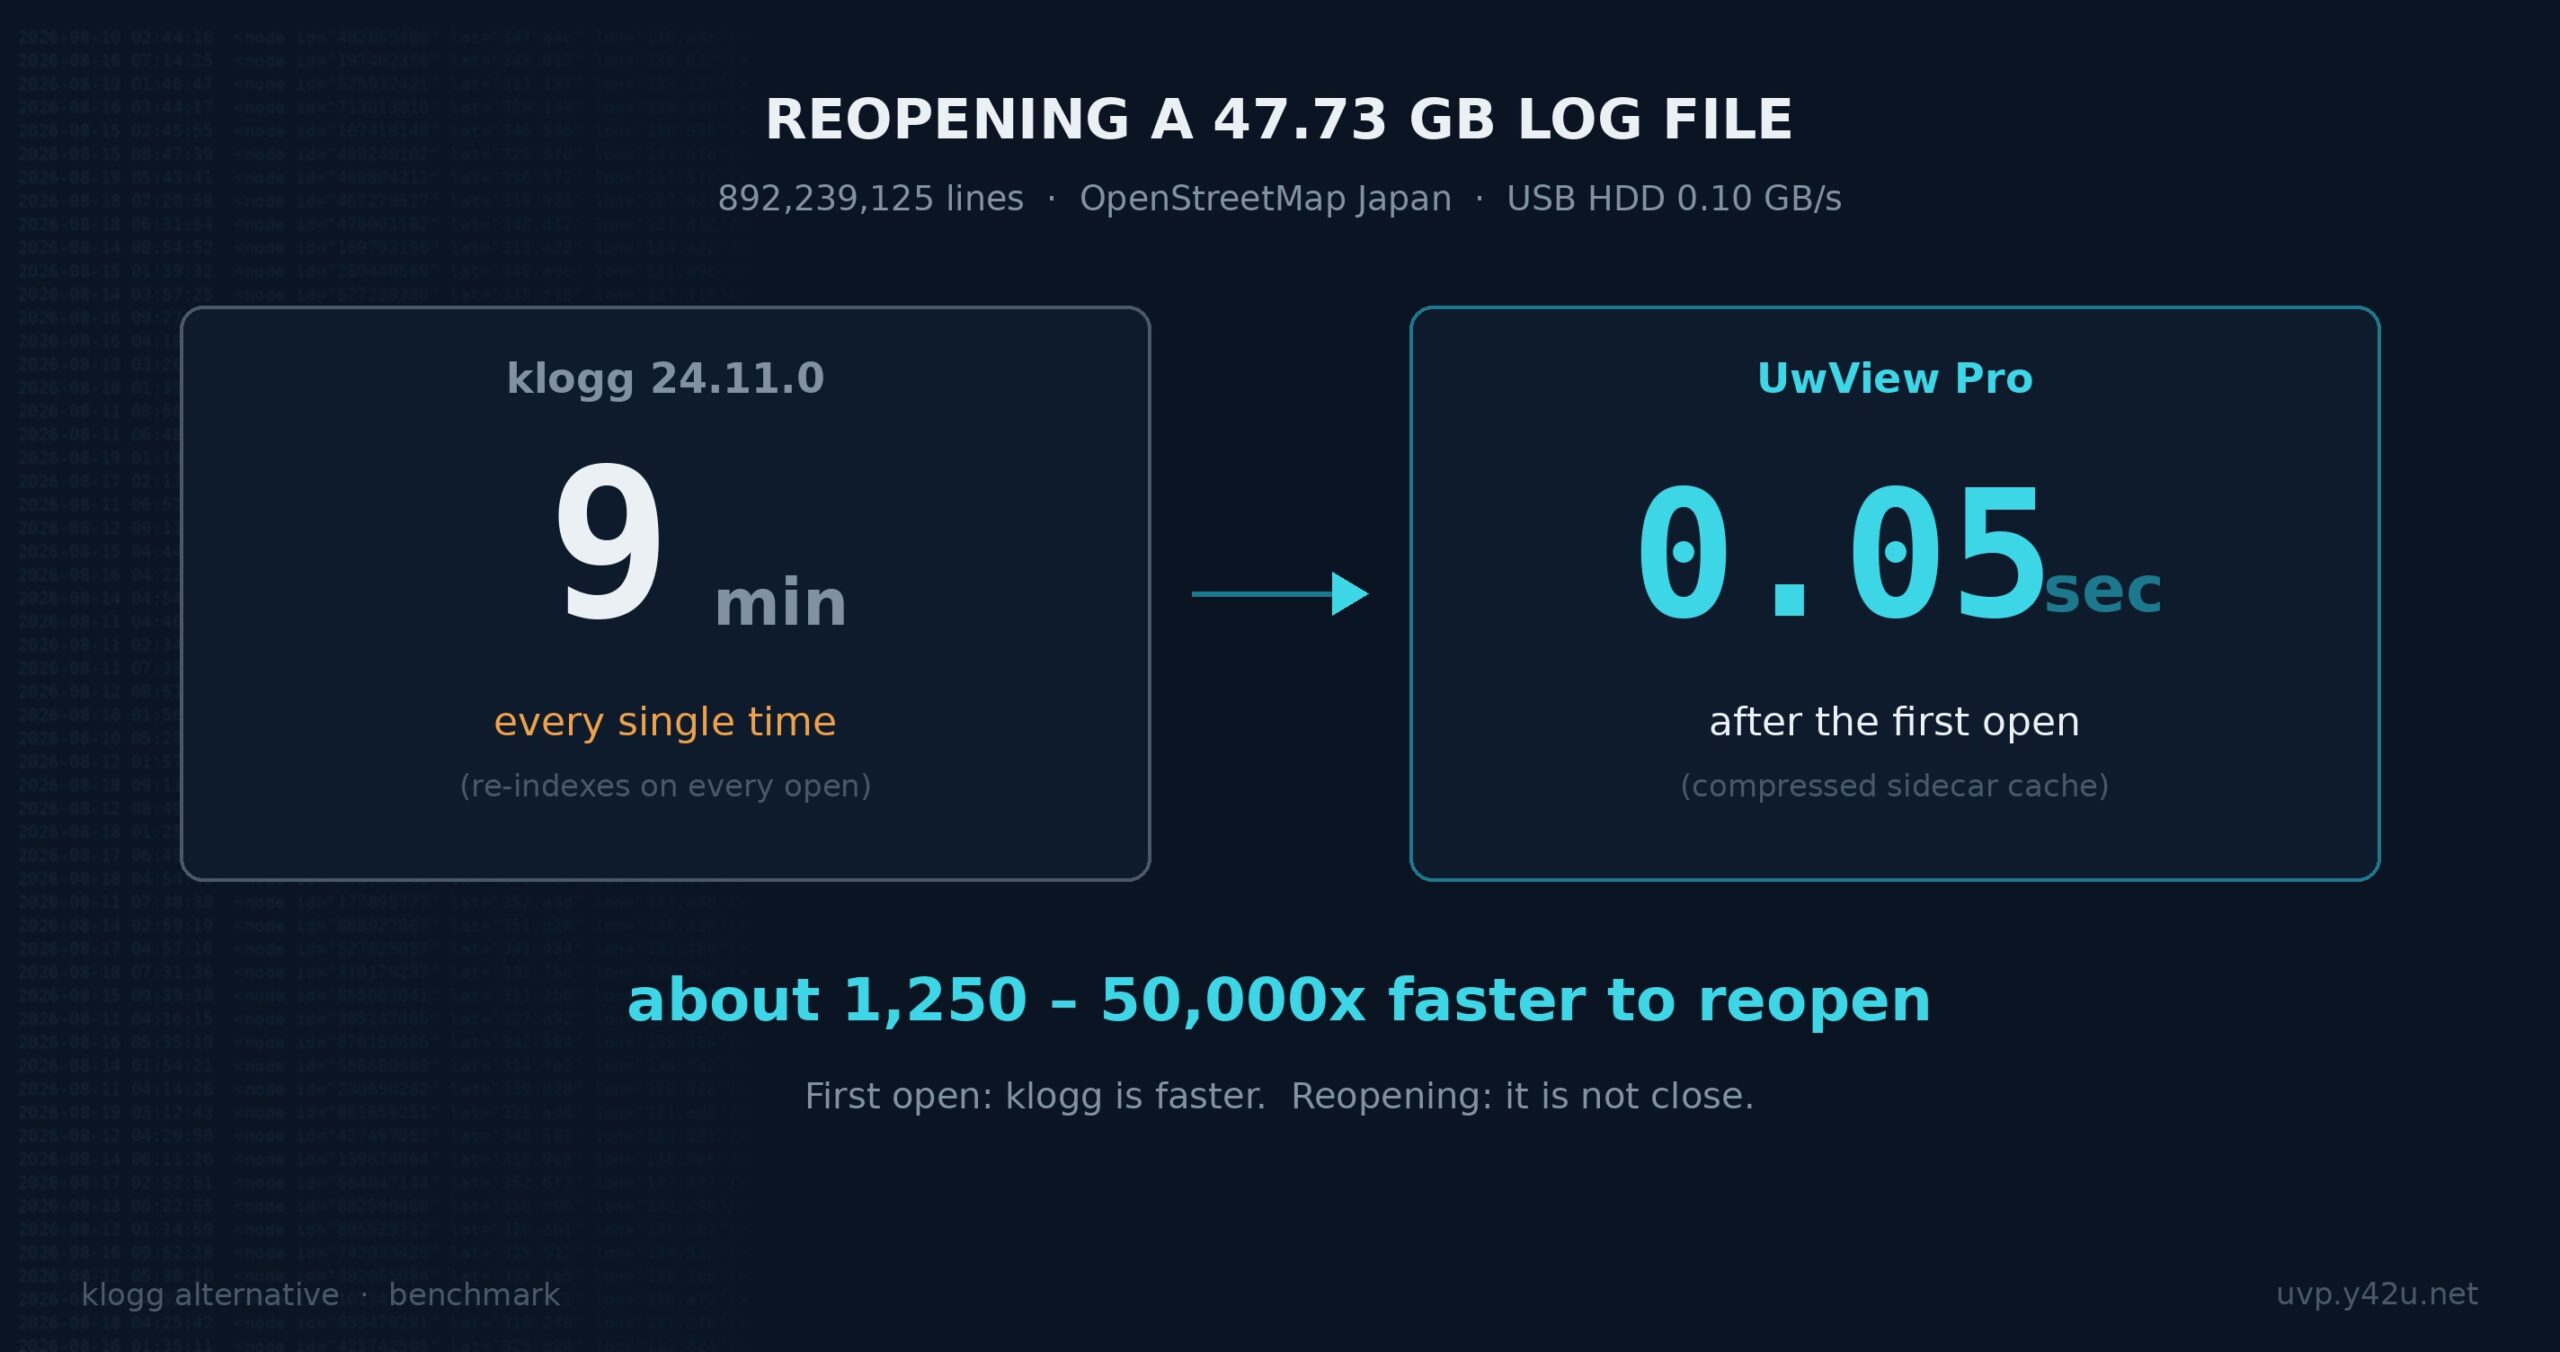
And if a huge log is eating your disk and you want it compressed for storage while staying searchable at speed, give UwView Pro a look — persistent index, compressed-cache search, and ~1/9 storage make both reopening and searching a step faster (all OS, one-time or monthly).
From the developer: a list of my apps, Kindle books and public projects is on GitHub: amru195704.
A note
The information in this article is provided for reference purposes only, and its accuracy or completeness is not guaranteed. Feature availability reflects each version as of the time it was checked, and may change in future updates. If you notice any errors or inaccuracies, please let us know in the comments and we will review and correct them.

コメント