You Found the ERROR. You Still Can’t Find the Cause — Four Ways to Trace Causality in Logs
grep ERROR worked. The red line is right there on your screen. And the “root cause” field in your report is still empty.
The step that eats the most time in an incident investigation isn’t finding the error. It’s tracing back from the error you found to the causality sitting just upstream of it. An ERROR line is a record of a result, not a record of a cause. The cause is usually written a little earlier, in another thread, or in another layer — wearing a different face.
This article lines up four ways to trace back: by time, by the exception chain, by how the log was cut off, and by the distribution of repeats. Each one is written assuming you start with the commands you already have — and then goes on to where that hand stops.
1. The line right above isn’t necessarily the cause — write order vs. event order
The situation
You look at the line above the ERROR. Unrelated access log. The line above that, and the one above that, also unrelated. You’re reading upstream exactly as the playbook says, and nothing resembling causality shows up. (The basic technique itself was covered in You Found the ERROR. The Cause Is in the Lines Before It; here we look at the conditions under which that playbook fails.)
Why it happens
The order of lines in a log file is not the order events happened — it’s the order they were written. The two diverge for reasons that aren’t rare at all.
Buffering and asynchronous logging. Most loggers accumulate writes and flush them in batches, and pushing writes through a queue to a separate thread is a common design. A configuration that flushes ERROR immediately creates a skew where the ERROR jumps ahead, while a congested queue reorders everything else. And the queue congests exactly when load is high — meaning the moment you most want to understand is the moment the ordering is least trustworthy. That’s a nasty property.
Interleaved lines. When several threads or processes write to the same file, the record of a single operation isn’t contiguous. An INFO from another thread lands in the middle of a ten-line stack trace. The “line right above” you’re reading is a line from a different story.
What generic tools can do, and where that stops
The first move is to group by identifier rather than by time. If a request ID, trace ID, or thread ID is being emitted, grep 'req-8f3a' pulls out just that one operation. Within it, the ordering is trustworthy at least inside a single thread.
Two limits. First, extracting by identifier deletes the context. The record of that one operation is clean, but “what was happening in other threads at the same instant” falls away. Resource exhaustion and lock contention are not written inside the single thread you pulled out.
Second, what you extracted is severed from the original. Even with grep -n line numbers, going back to that position in the original file to look more widely around it is manual work. And an incident investigation is priced by the number of those round trips.
2. The Caused by chain — hunting for the first exception
The situation
The stack trace is there. But the line at the top reads ServiceException: request failed — a sentence that says nothing. The real cause is below the Caused by:, below the one under that, and further down still.
Why it happens
Wrapping exceptions is correct practice at layer boundaries. A SQLException thrown by the DAO gets wrapped by the service layer in a DataAccessException, and the controller wraps that in an ApiException. Each layer restates the failure in its own vocabulary and keeps the original as cause.
As a result, the trace that lands in the log is written outside-in. That’s the reverse of the order a human wants to read (root cause = innermost). And since each exception drags dozens of frames along with it, a three-level wrap easily runs past 100 lines.
Then there’s ... 47 more. Common frames are omitted, so when the clue lives inside what was omitted, that trace alone won’t get you there. And a stack trace carries one meaning across many lines. It’s fundamentally a poor match for tools that slice by the line.
What generic tools can do, and where that stops
Listing the Caused by: positions and cutting out one trace with a hard-coded line count is quick enough.
grep -n "Caused by:" app.log | tail -20  # positions of the chain
sed -n '1043210,1043400p' app.log        # 190 lines from that position
The limit is that you can’t know whether 190 lines is enough until you’ve cut it out. Too few and you re-run with a bigger number; too many and the next trace bleeds in. The number of wrapping levels differs per error type, so a hard-coded width misses every time.
You end up repeating this “cut, come up short, redo” loop across dozens of traces. You’re solving a viewing problem with repeated extraction. On top of that, sed -n counts line numbers from the start of the file, so cutting from the back half of a several-hundred-million-line file means waiting.
3. No core dump — reading the crash from how the log was cut off
The situation
The process died. Core dumps weren’t configured, or ulimit -c 0 meant none was taken. All you have is a log file that just stops mid-flow.
Why it happens
A log at crash time has characteristics that ordinary failures don’t.
The tail is incomplete. Whatever was still in the buffer never gets written, so the last line can be cut off mid-line. A file tail that doesn’t end in a newline is itself information: the normal shutdown path was not taken.
The last record sits slightly behind the cause. Because of buffering, the process got a little further than the final line in the log. Read the tail as “this point was definitely reached“, not “it died here”. The culprit is past it.
Some deaths never reach the application log at all. A kill by the OOM killer shows up in dmesg or /var/log/messages. A signal-induced instant death leaves nothing in the application log unless a handler was installed. A good fraction of what looks like “an unexplained sudden death” is this.
What generic tools can do, and where that stops
Checking the state of the tail is easy.
tail -c 1 app.log | xxd          # is the last byte 0a?
tail -50 app.log                 # the final records
After that, compare against the log from the last clean shutdown. The “shutdown initiated” line that appeared every previous time and is missing now — that difference is itself the evidence.
The limit is that this investigation is essentially “going back and forth between the tail and similar places in the past“. tail only shows you the tail. Finding the normal-shutdown pattern in history requires a whole-file search, and reading around the position you found requires yet another operation. And in a crash investigation, not touching the original matters: opening an editing tool just to read is itself the risk.
4. Counting “how many times” deletes the context
The situation
The same ERROR keeps pouring out. You want the count first, so you run grep ERROR app.log | wc -l. It prints “1,847”. And then you have no idea what to do next.
Why it happens
Because a count, on its own, is a number that says almost nothing.
Time distribution. If those 1,847 are spread evenly across 24 hours, that may be a known and harmless noise floor. If they’re packed into three minutes, that’s an incident. The same number means opposite things. “When did it start?” — also not something a count will tell you.
Breakdown. Are they all the same message, or five kinds mixed together? If mixed, the most numerous isn’t necessarily the cause. The exception that appears exactly once is the trigger, and the remaining 1,846 are the cleanup cascade — that shape is common. And in the end you need to read that one occurrence with its surroundings. Counting is the operation that pushes that very line out of view.
What generic tools can do, and where that stops
Distribution and breakdown are both reachable with pipes.
grep ERROR app.log | cut -c1-16 | uniq -c    # per-minute histogram
grep ERROR app.log | sed 's/[0-9]\+/N/g' | sort | uniq -c | sort -rn | head  # by kind
You see the spike and the relative weight of each kind at once, so this far is genuinely useful.
The limit is that you can’t go further from here. Say the histogram shows a spike at 10:23. What you want next is “read the first occurrence in the 10:23 window, with 100 lines of context”. But what you’re holding is an aggregate, not a position in the original. So you run grep -n for a line number again, cut with sed -n, and redo it when it’s short — you’re back in the same round trip as section 2.
What the four have in common
The ways of tracing back differ, but they stop in the same place.
| Technique | What you trace by | Where it stops |
|---|---|---|
| Suspect the write ordering | Request ID / thread ID | Extracting deletes the surrounding context |
| Follow Caused by | The exception chain | The cut width can’t be decided in advance |
| Read how it was cut off | Tail state, diff against the past | Waiting on each trip between tail and history |
| Get distribution and breakdown | Time distribution, kinds | No way back from the aggregate to the one line |
All four jam at the round trip from “the list” back to “the scene”.
grep, awk, and sort are tools that turn text into different text. What they produce carries no information about where in the original file it came from — not as a position, even with line numbers attached. Tracing causality is precisely the work of moving back and forth to “where in the original”, so it’s aimed somewhere the transformation tools aren’t.
Turn that around, and what this step needs is the ability to keep the original open as the original, and move between the list and the scene. Jump from a search hit to the line, scroll as far up or down as you like from there, and get back to the list. You never have to decide the extraction width in advance; when it’s not enough, you just keep scrolling.
The catch is that making those round trips work on a log of several to several dozen GB depends on being able to look before the whole file has been read. With a tool that makes you wait minutes just to open, one round trip costs too much and you give up before you’ve traced anything. The limits of the tools covered last time apply directly to this step too.
The tool I use
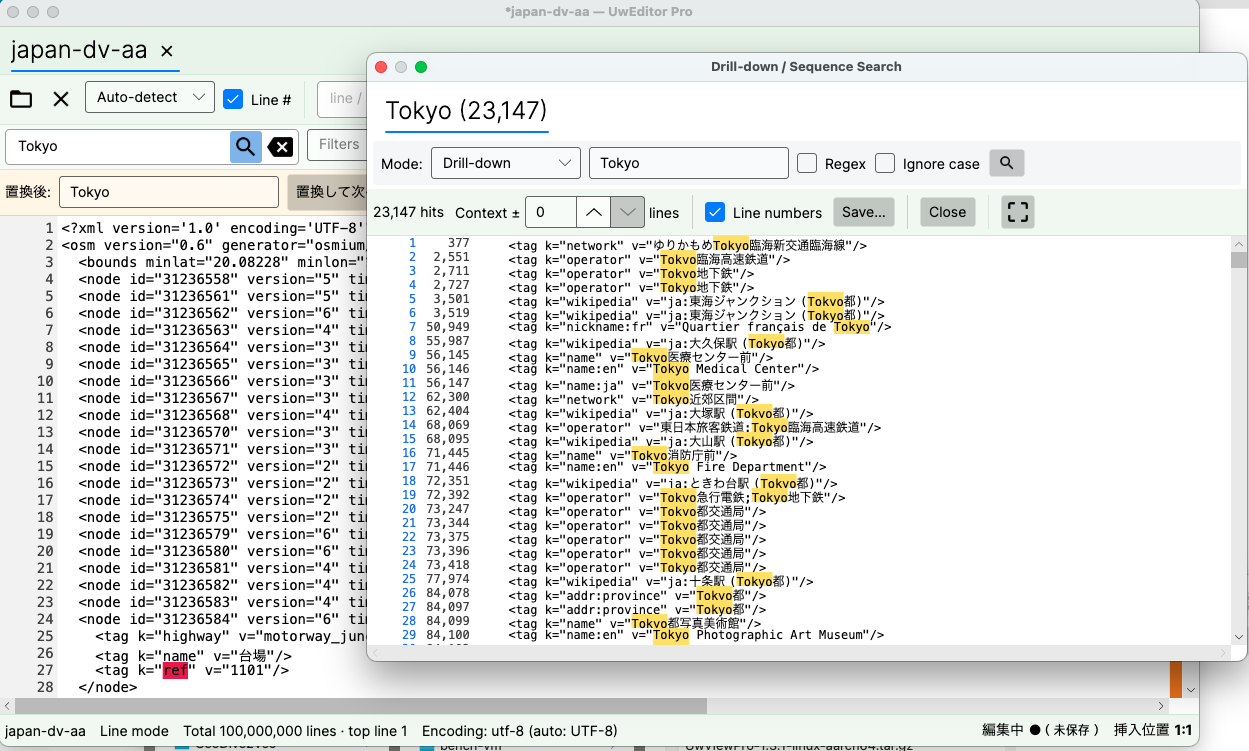
UwView (free), which I develop, is a viewer built for exactly these round trips. Even with huge logs it displays, scrolls, and searches the whole file from the moment it opens; the index is built in the background, and line numbers appear when it completes (most other viewers show only the head until indexing finishes). Search results are listed in an independent popup — double-click a row and the main view jumps to that position, and from there you can scroll upstream as far as you want. Nothing is extracted, so the original stays a single, unmodified file. And if a huge log is hogging your storage and you want it compressed for keeping — and searched even faster — there’s UwView Pro: persistent index, compressed-cache search, storage at roughly 1/9 size, and faster reopen and search across the board (from the second time on, files open instantly with line numbers; all OS supported; one-time or monthly).
The same things, from the command line
v1.6.0 added a uvp command (and uvf for the free build). It uses the same .uwvz as the GUI, so an index built from the shell is already there when you open the file in the app. Mapped onto this article’s four parts:
# Part 1: don't trust write order — read 100 lines each side of the hit
uvp app.log 'NullPointerException' -C 100

# Part 2: take the Caused by chain as "these, in this order"
uvp app.log -seq 'RequestFailed,Caused by'

# Part 3: rank what the last lines look like, to guess where it was cut off
uvp app.log -uniq '^\S+ \S+ (\w+)' -head 20

# Part 4: after counting, the context is still one command away
uvp app.log 'ERROR' 'ConnectionPool' -C 40 -open
Exit codes are grep’s — 0 found, 1 not found — plus 2 when a limit is hit and the output is cut off (no limit by default; only when you set one with -limit N). For part 4’s counting problem, that 2 is simply the signal to narrow the question instead of reading the count.
Stated honestly: on the first question uvp is a little slower than ripgrep — it builds its .uwvz (a compressed cache plus index) first, 59.0 s against 54.9–55.8 s at 50 GB, 6–7%. In v1.6.6.1 it searches while building the index instead of re-reading it afterwards, which cut 6.7 s. It starts paying from the second question: the same 50 GB search takes 6.6 s against ripgrep’s 55–57 s — 8.4×. On a small file such as 3 GB the two are level, because an index has little to earn there. The free uvf is level with ripgrep at every size (the measurements; Mac M4, external USB SSD, OpenStreetMap XML — one setup, results vary).
Links
- Previous: four go-to tools that sink under huge files: https://uvp.y42u.net/en/blog/uwview-ps01-huge-file-tool-limits-en/
- The basic procedure for tracing context around an ERROR: https://uvp.y42u.net/en/blog/uwview-error-context-cause-en/
- How the hit list and the source view move together: https://uvp.y42u.net/en/blog/uwview-filter-popup-jump-save-context-en/
- We shipped a
uvpcommand (measured against ripgrep): https://uvp.y42u.net/en/blog/uvp-cli-release-vs-ripgrep-en/ - Source code (GitHub): https://github.com/amru195704/UwView
From the developer: My apps, Kindle books, and public projects are listed at GitHub: amru195704.
A note
The information in this article is provided for reference and is not guaranteed to be accurate or complete. Log write ordering and buffering behavior depend on the logger implementation and its configuration. Command examples may need adjusting for your environment (GNU vs. BSD differences, etc.). If you find an error or inaccuracy, please point it out in the comments and it will be corrected after verification.