We were getting 57% of the disk.
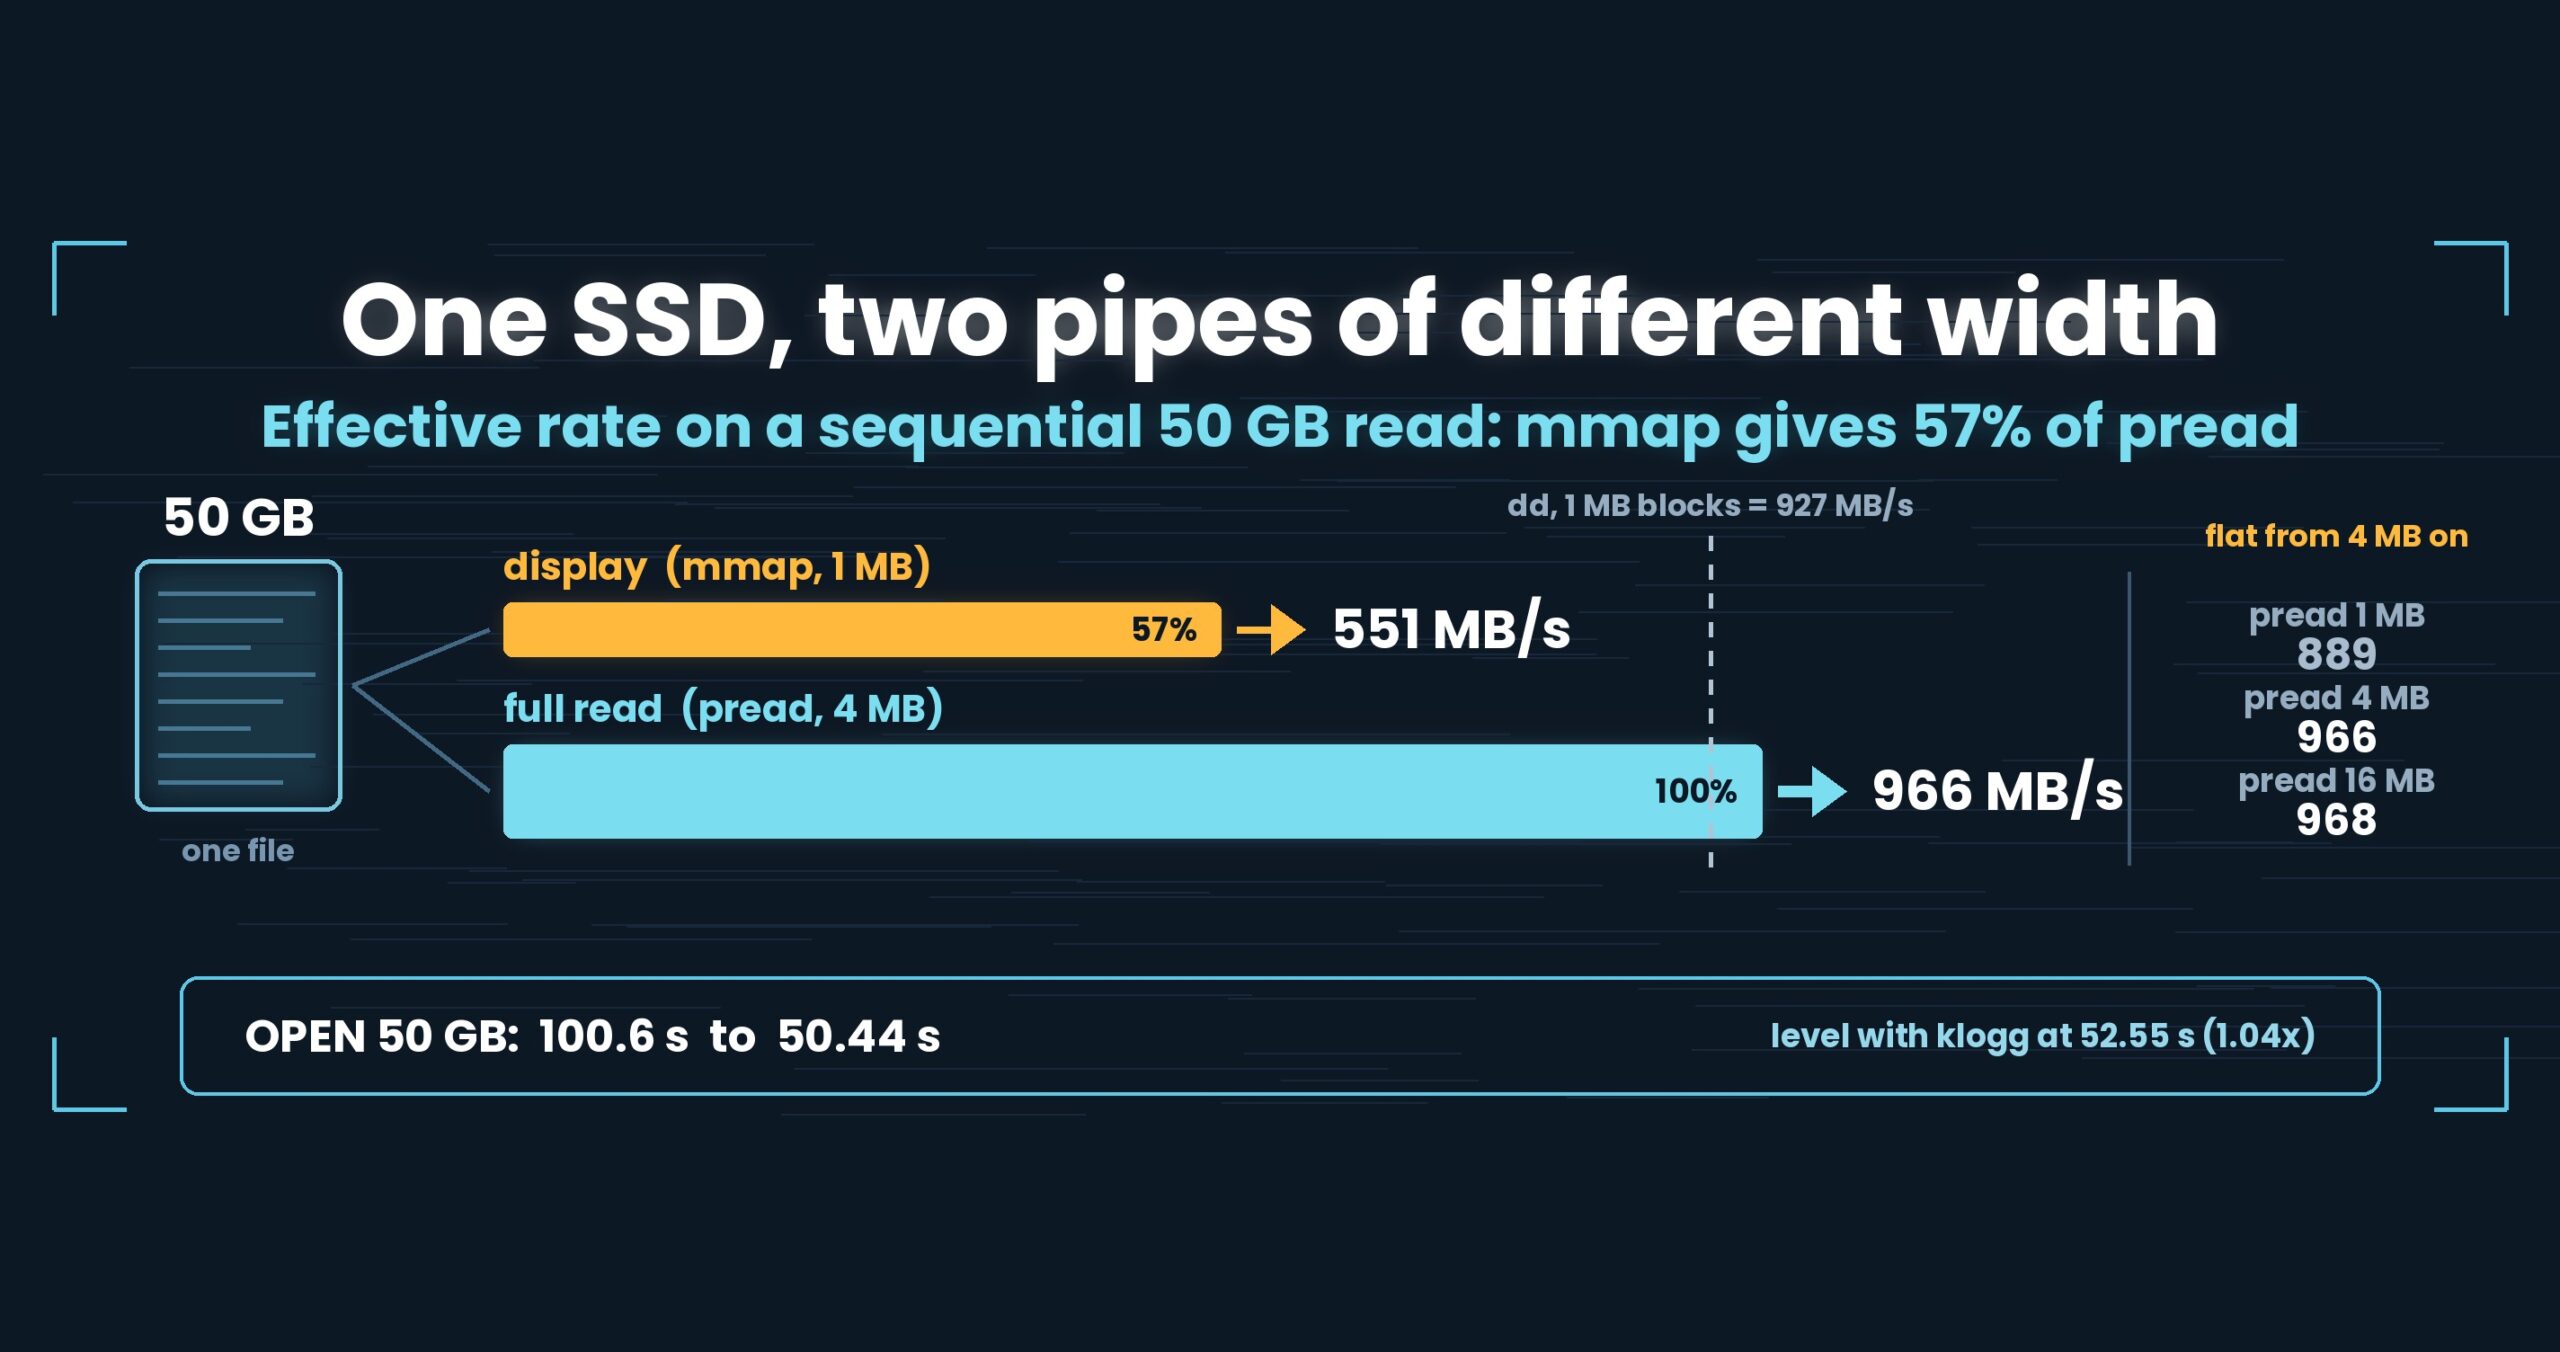
An external USB SSD gives 927 MB/s under dd. Read the same 50 GB file from the same SSD through mmap, 1 MB at a time, and you get 551 MB/s.
Why the gap — and which of the two is the “right” way to read a file?
Up front: one file, two ways of reading it
We gave a single open file two read paths: mmap stays for display, while index building and full-text search moved to pread (RandomAccess). That one split took opening a 50 GB file from 100.6 s to 50.44 s (486 → 969 MB/s) and searching from 88.9 s to 53.50 s (550 → 914 MB/s). Against klogg, which opens the same file in 52.55 s, we went from 1.9x behind to level. The measured rates: dd 927, mmap + 1 MB 551, pread + 1 MB 889, pread + 4 MB 966, pread + 16 MB 968 MB/s — so mmap delivers 57% of pread, and the curve is flat from 4 MB on. Mac (Apple M4, 10 cores), 32 GB RAM, external USB SSD, OpenStreetMap XML, median of three runs. Details at the end.
About this series. “First Light” is the pet name of UwView v1.6.6 — the release where both the GUI and the command line
started opening and searching a huge file in a single pass. This series follows what that took, one fix at a time.
The problem: the command line got fast and left the window behind
Part 2 of this series took the command line from 203 s to 50.82 s on a 50 GB search. Almost none of that reached the GUI in the same codebase.
Here is where the window stood on the same file:
| Operation, 50 GB | UwView at the time | klogg 24.11 | Ratio |
|---|---|---|---|
| Open (until line numbers are available) | 100.6 s | 52.55 s | 1.91x behind |
| Search (after opening) | 88.9 s | 55.59 s | 1.60x behind |
| Open then search | 189.5 s | 108.14 s | 1.75x behind |
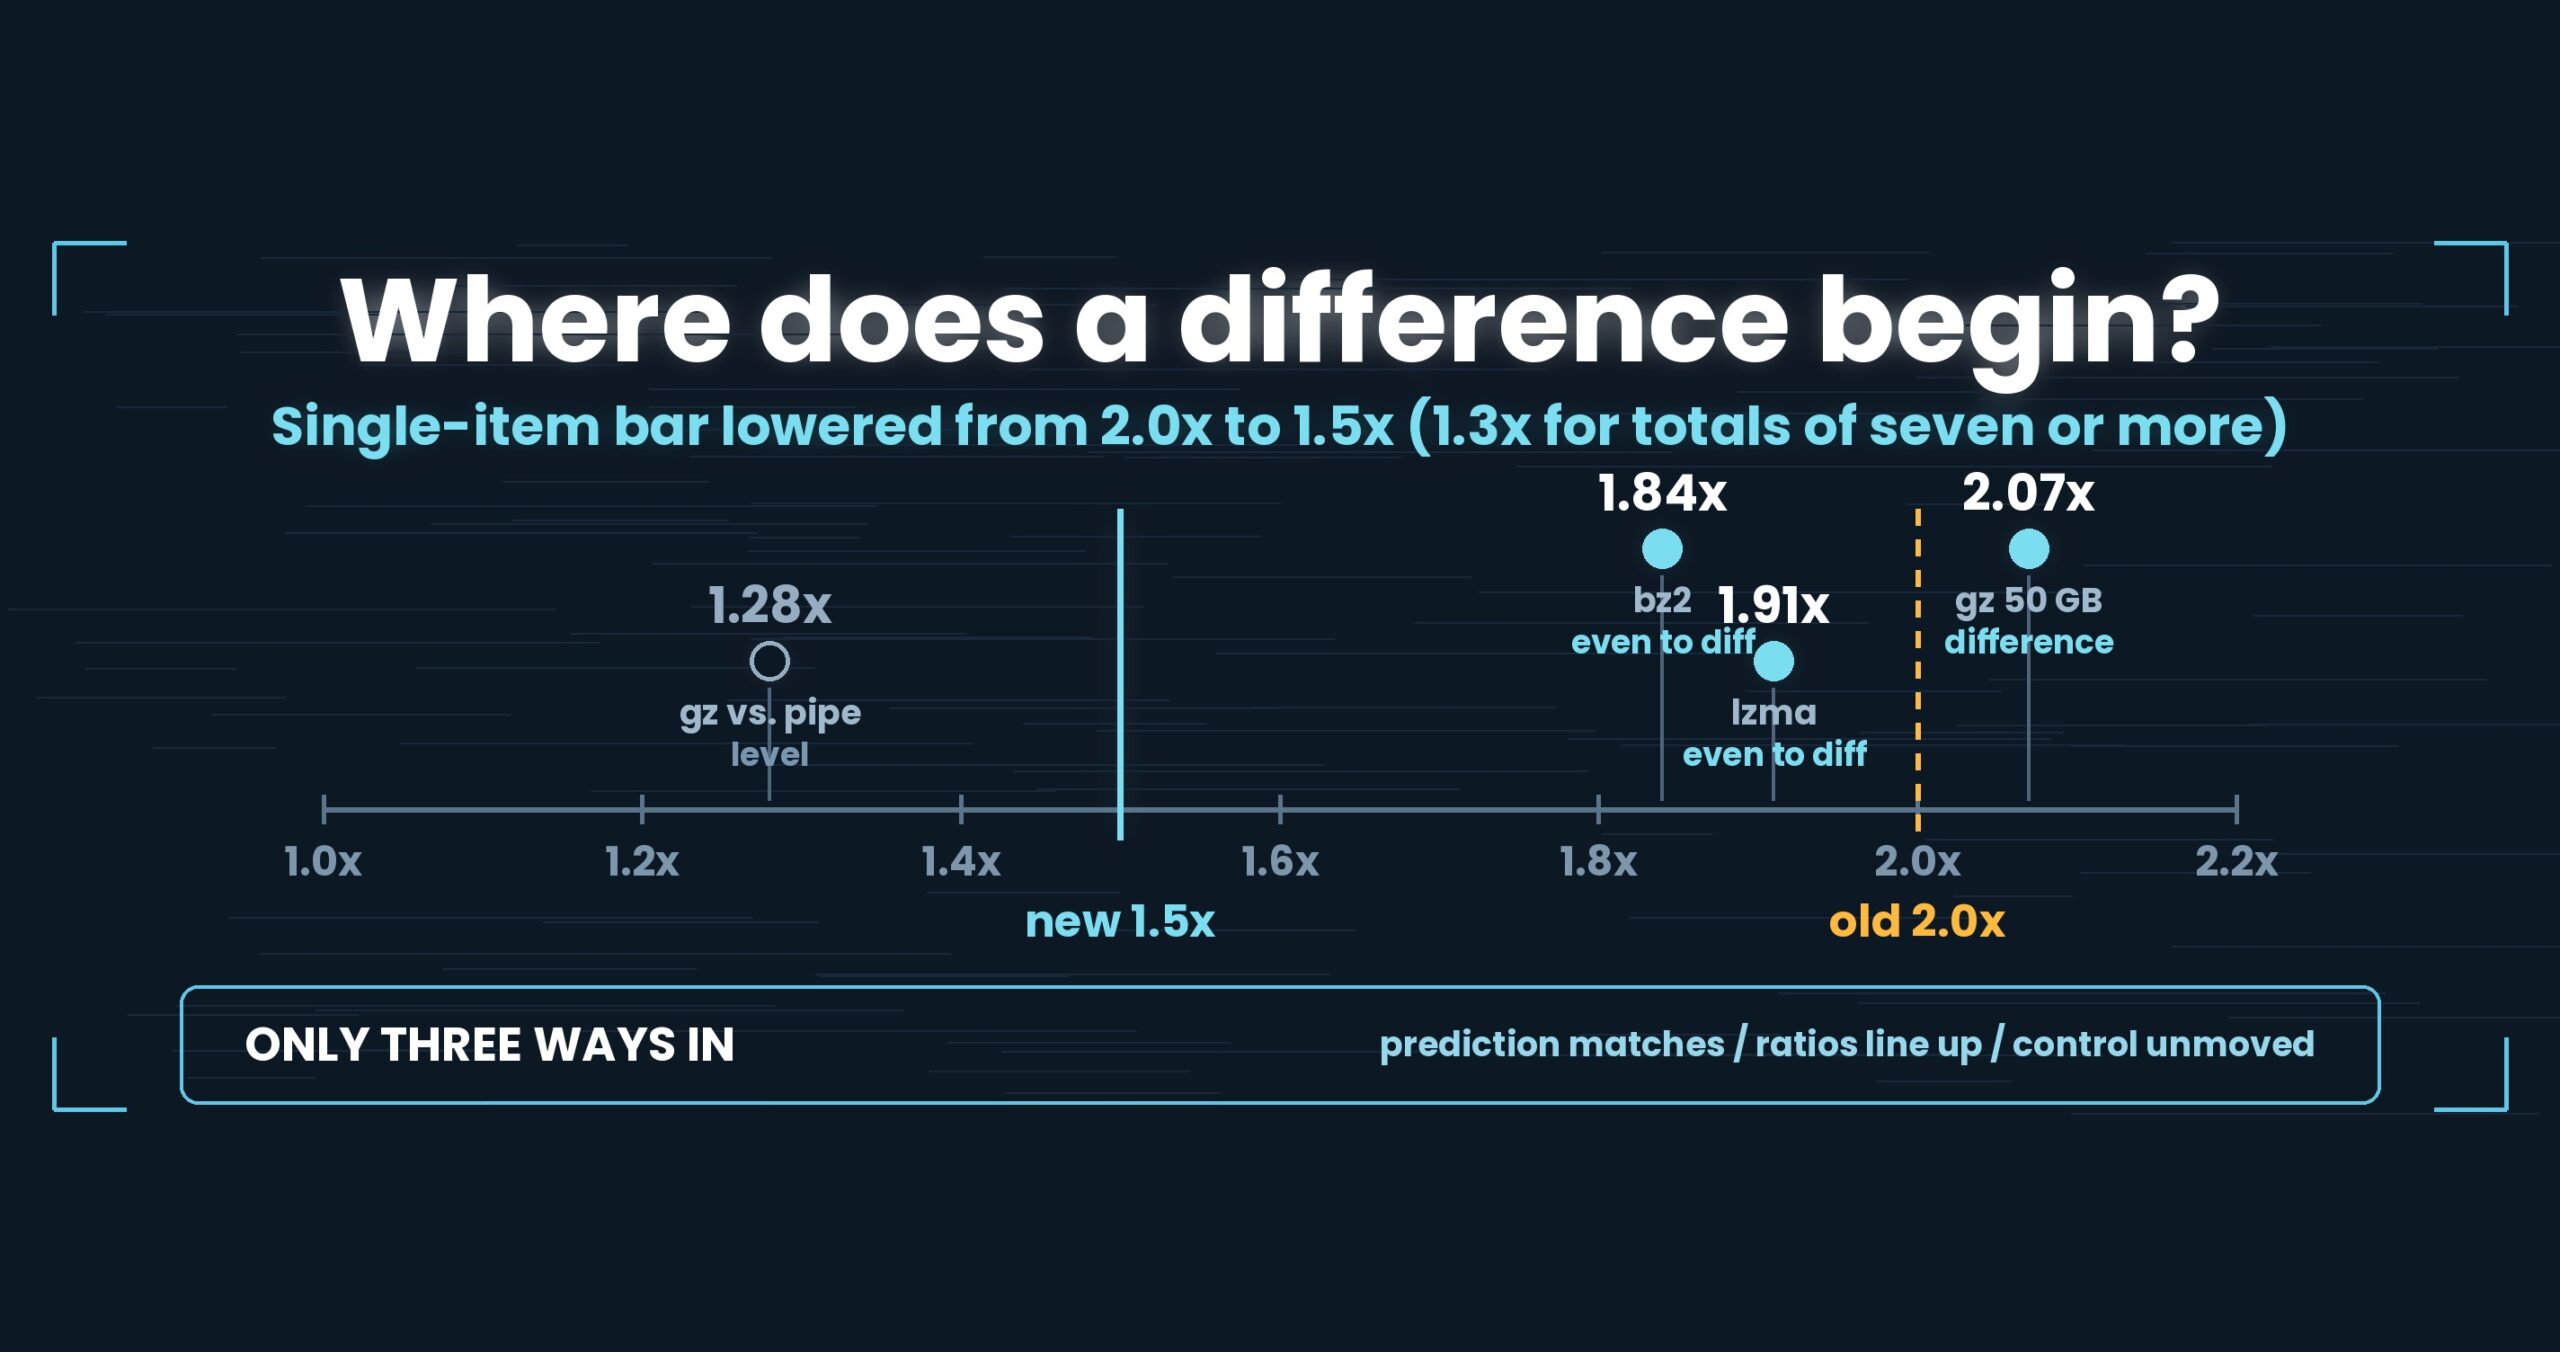
Every one of those clears 1.5x on a single item, so they count as real differences by the rules in Part 9. And on the same machine, with the same file, the command line was doing it in 50.82 s. Inside one product, the window was spending twice the time.
Our first suspect was the search implementation. Wrong.
The cause: we only had one way of reading
The slowness was not in how we searched. It was in how we read, and how many times.
mmap gives you 57% of the disk on a sequential read
When the window opens a file it maps it with mmap. The file lands in the address space and you touch it like an array. For a scrolling viewer that is exactly right — any offset is instantly reachable.
The mistake was reusing that same mapping for index building and full-text search, which both walk the file from start to end.
Re-measured on 2026-09-20 (50 GB, median of three runs):
| Read path | Effective rate | vs. pread + 4 MB |
|---|---|---|
dd, 1 MB blocks (rough read-only ceiling) |
927 MB/s | — |
mmap, 1 MB at a time |
551 MB/s | 57% |
pread (RandomAccess), 1 MB at a time |
889 MB/s | 92% |
pread, 4 MB blocks |
966 MB/s | 100% |
pread, 16 MB blocks |
968 MB/s | 100% |
The reason mmap loses is not mysterious. Touching a page faults, the kernel materialises it, and then the bytes are copied into your own buffer. On a sequential read that round trip happens once for every page in the file. pread asks for 4 MB in one call, so the number of round trips drops by orders of magnitude.
The interesting part is where the curve stops. 16 MB blocks give 968 MB/s — 2 MB/s more than 4 MB blocks. By 4 MB the bottleneck has already moved to the device. Reading in parallel topped out around 960 MB/s as well, which is the SSD saturating. So the full read stays single-threaded: we decided not to add threads after measuring that threads would not help.
Two numbers lined up exactly
One detail is worth pausing on: search, before the change, ran at 550 MB/s.
The ceiling for mmap is 551 MB/s. Search measured 550 MB/s. Search was pinned to the ceiling of its read path. There was no clever matching left to extract — the only remaining move was to change how the bytes arrive.
Index building, by contrast, ran at 486 MB/s — below the mmap ceiling. Something other than the read path was also holding it back, and that turned out to be how newlines were counted (Part 11).
“Slow” splits into two cases: pinned to the ceiling, or below it. They have different fixes.
And we were reading the file twice
The simpler half: the window read once to build the index and again to search. The 189.5 s end-to-end figure is essentially 100.6 + 88.9. The command line reads once (Part 2).
The fix: two read sources, chosen by purpose
We added a dedicated sequential read source (ScanSource) to DocumentSession.
- Display keeps
mmap. Unchanged, deliberately. Jumping to the end of a freshly opened file, peeking at an arbitrary offset, re-mapping to follow a file that is still being appended to (Tail) — none of that is cheap without a mapping - Index building and full-text search use
pread. Only the paths known in advance to run start-to-end go through the newSequentialFileByteSource(RandomAccess, 4 MB at a time)
Commits: 83e1e4e (SequentialFileByteSource.cs) and 08fd81d (wiring the window to it).
Put differently: we stopped deciding “how this file is read” once and globally. One input, two purposes. Random access wants mmap; a full read wants pread. Letting the purpose pick the reader is the design change in this part.
For the read count, the window now behaves like the CLI: if a search starts while the index is still being built, the in-flight index job is abandoned and one pass does both, using the same matching code as the command line. The index is kept only when the pass reaches the end; if the search was truncated by a limit, no index is recorded.
The trap: pread returns synchronously
We shipped a hang doing this. pread returns synchronously, so running it on the UI thread means await never yields control even once — 50 seconds of a frozen window at 50 GB, about four and a half minutes at 258 GB. Wrapping it in Task.Run fixed it (64f80c7).
The regression test we added does not look at timings. It asserts that hit notifications arrive on a thread other than the caller’s. Anything running on the UI thread fails it deterministically. “Too slow” is hard to test; “arrives on another thread” is not.
The numbers
| Operation, 50 GB | Before | After | Ratio | klogg 24.11 |
|---|---|---|---|---|
| Open (until the index exists) | 100.6 s (486 MB/s) | 50.44 s (969 MB/s) | 1.99x | 52.55 s |
| Search (after opening) | 88.9 s (550 MB/s) | 53.50 s (914 MB/s) | 1.66x | 55.59 s |
| Search while indexing (one pass) | hang | 50.6 s (966 MB/s) | — | — |
| Open, then search separately | 116.4 s (59.98 + 56.38) | same shape, faster passes | — | 108.14 s |
Open and search are now level with klogg — 1.04x and 1.04x, which under our own rules is “even”, not “a win”. The honest sentence is: a gap of roughly 2x became no gap.
And the 50.6 s single-pass figure works out to 966 MB/s, the same number as pread + 4 MB. That path is running at the speed of the device.
Scaled to a 258 GB file, the read path alone accounts for an estimated 459 s versus 273 s. That is arithmetic from the bandwidths, not a measurement.
Being straight about this
- Every figure above comes from Mac (Apple M4, 10 cores), 32 GB RAM, an external USB SSD, OpenStreetMap XML (51,254,526,392 bytes, written as “50 GB” here). Internal NVMe or another OS will give different numbers. The
mmap/preadgap should widen on faster media, but we have not measured that - Index building after the change reports 969 MB/s, above
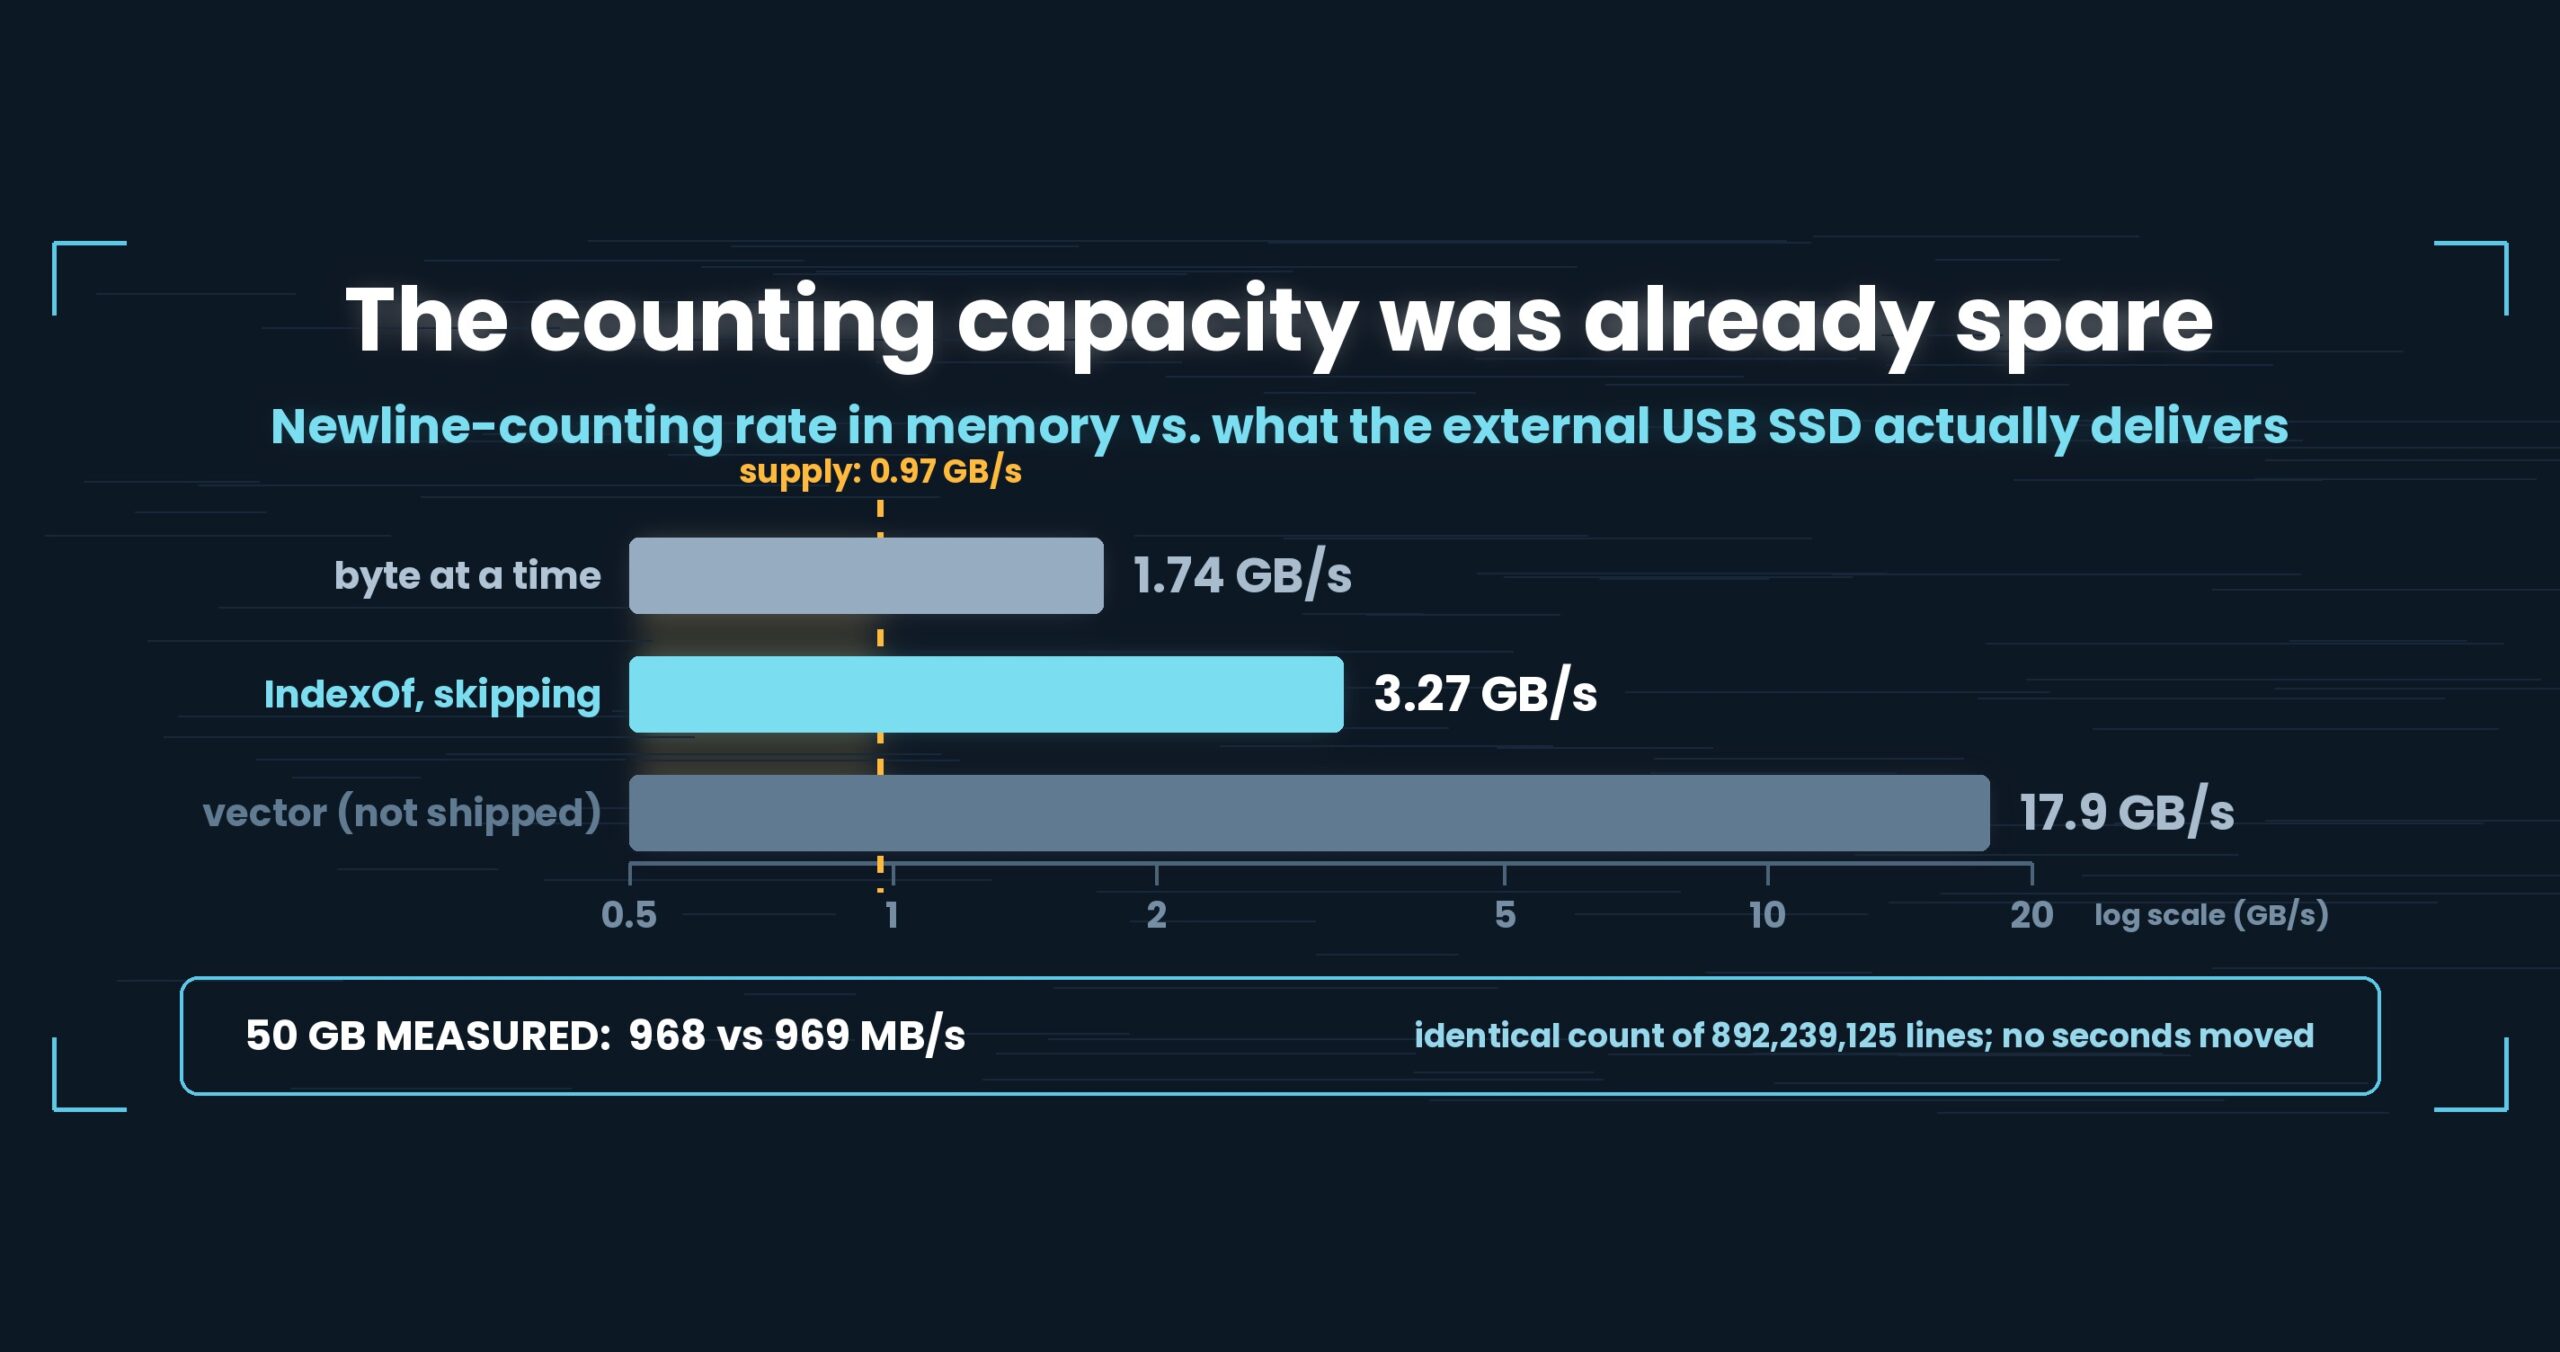
dd‘s 927 MB/s. That looks backwards, and the explanation is thatddwas measured with 1 MB blocks and is not the device’s real ceiling —preadat 966–968 MB/s is closer to it. It is a live example of the Part 9 rule: a number above the raw-read ceiling is evidence of a measurement problem, not of speed - The four bandwidth figures are the median of three runs taken on 2026-09-20. Values we had previously left in a source comment came from a single run on a different day and differ slightly; only the re-measured set appears here
- The klogg comparison is hand-timed with a stopwatch, from the open action until the count settles. Human reaction time is included. It is not an automated harness
- I develop one of the two tools being compared. Discount accordingly
- We have also measured why ripgrep avoids
mmapon large files, but that is a separate article. This one is strictly about how our own app reads
What generalises
(1) mmap is not fast or slow — it is suited or unsuited. Unbeatable for random access; 57% of pread for a sequential read. The same API differs by nearly 2x depending on the use. “mmap is fast” means nothing until you say which use you mean.
(2) One input may legitimately have several readers. Textbook abstraction says funnel “read a file” through one interface. Fair — but pointing only the known start-to-end paths at a different implementation is a design decision, not a failure of abstraction. Two readers were enough here: display and full read.
(3) Check whether you are pinned to the ceiling before optimising. Search sat at 550 MB/s against an mmap ceiling of 551. A stage pinned to its ceiling will not move however much you tune the stage itself — the read path has to change. Index building sat at 486, below the ceiling, so it had a second cause. One measurement tells you which building to enter.
(4) Measure block size until it stops paying. 1 MB to 4 MB buys 889 → 966 MB/s. 4 MB to 16 MB buys 966 → 968. Skipping the measurement and assuming “bigger is faster” just pins more memory for nothing.
The tools
UwView is a viewer for huge text and log files (free UwView / paid UwView Pro).
Doing the same thing from the command line
This part changed the window, but the difference between read paths is easy to confirm yourself.
# Rough ceiling for the medium (try a couple of block sizes)
dd if=huge.log of=/dev/null bs=1m count=20000
dd if=huge.log of=/dev/null bs=4m count=5000

# Search in a single pass (the CLI has worked this way from the start)
/usr/bin/time -p uvf huge.log 'ERROR' > /dev/null

# Hand the hits straight to the window instead of reading twice (Part 6)
uvf huge.log 'ERROR' -open

# Count first, read later
uvf huge.log 'ERROR' -count
Exit codes match grep: 0 = found, 1 = not found, 2 = error or incomplete result.
Honestly: the first query with uvp is a little slower than ripgrep, because it builds the .uwvz (UwView Pro’s compression format plus index) first — at 50 GB, 59.0 s vs. 54.9–55.8 s = 6–7% (v1.6.6.1). It pays off from the second query on: the same 50 GB search returns in 6.56 s, about 8.4x ripgrep. On small files like 3 GB it is about even. The free uvf is on par with ripgrep at any size (measured article; Mac (Apple M4, 10 cores), 32 GB RAM, external USB SSD, OpenStreetMap XML — one setup, results vary).
Links
- Part 2 — folding two and a half reads into one: https://uvp.y42u.net/en/blog/uwview-fl02-one-pass-rawgrep-en/
- Part 6 — handing the CLI’s results to the window: https://uvp.y42u.net/en/blog/uwview-fl06-cli-to-gui-handoff-en/
- Part 7 — the 3 GB file lost to startup cost, not I/O: https://uvp.y42u.net/en/blog/uwview-fl07-3gb-fixed-cost-en/
- Part 9 — where a difference begins: https://uvp.y42u.net/en/blog/uwview-fl09-difference-threshold-en/
- Why ripgrep skips mmap at 50 GB: https://uvp.y42u.net/en/blog/uvp-rg-no-mmap-50gb-en/
- Opening, searching and end-to-end against klogg: https://uvp.y42u.net/en/blog/uvp-klogg-open-lose-flow-win-en/
- Source (GitHub): https://github.com/amru195704/UwView
And if huge logs are eating your storage and you want them kept compressed and still searchable, try UwView Pro: a persistent index, search inside the compressed cache, and about 1/9 the storage, with reopening and searching both a step faster (all OSes; one-time purchase or subscription).
From the developer: a list of my apps, Kindle books, and open source is at GitHub: amru195704.