1.28× is not a win.
When your own tool comes out 1.28× ahead of the competition, do you get to write “faster”? If you have not answered that before measuring, the answer moves to fit the result.
So: from what ratio onward is it allowed?
- Up front: the rules are written down, and they predate the numbers
- The problem: a benchmark number can be read whichever way suits you
- The fix: three rules, parked inside the performance report
- Where it actually mattered: all three kinds got used
- Lowering the bar from 2× to 1.5×
- The environment breaks before your judgment does
- The general lesson: criteria can only be written before the result
- The tools behind this
- Links
Up front: the rules are written down, and they predate the numbers
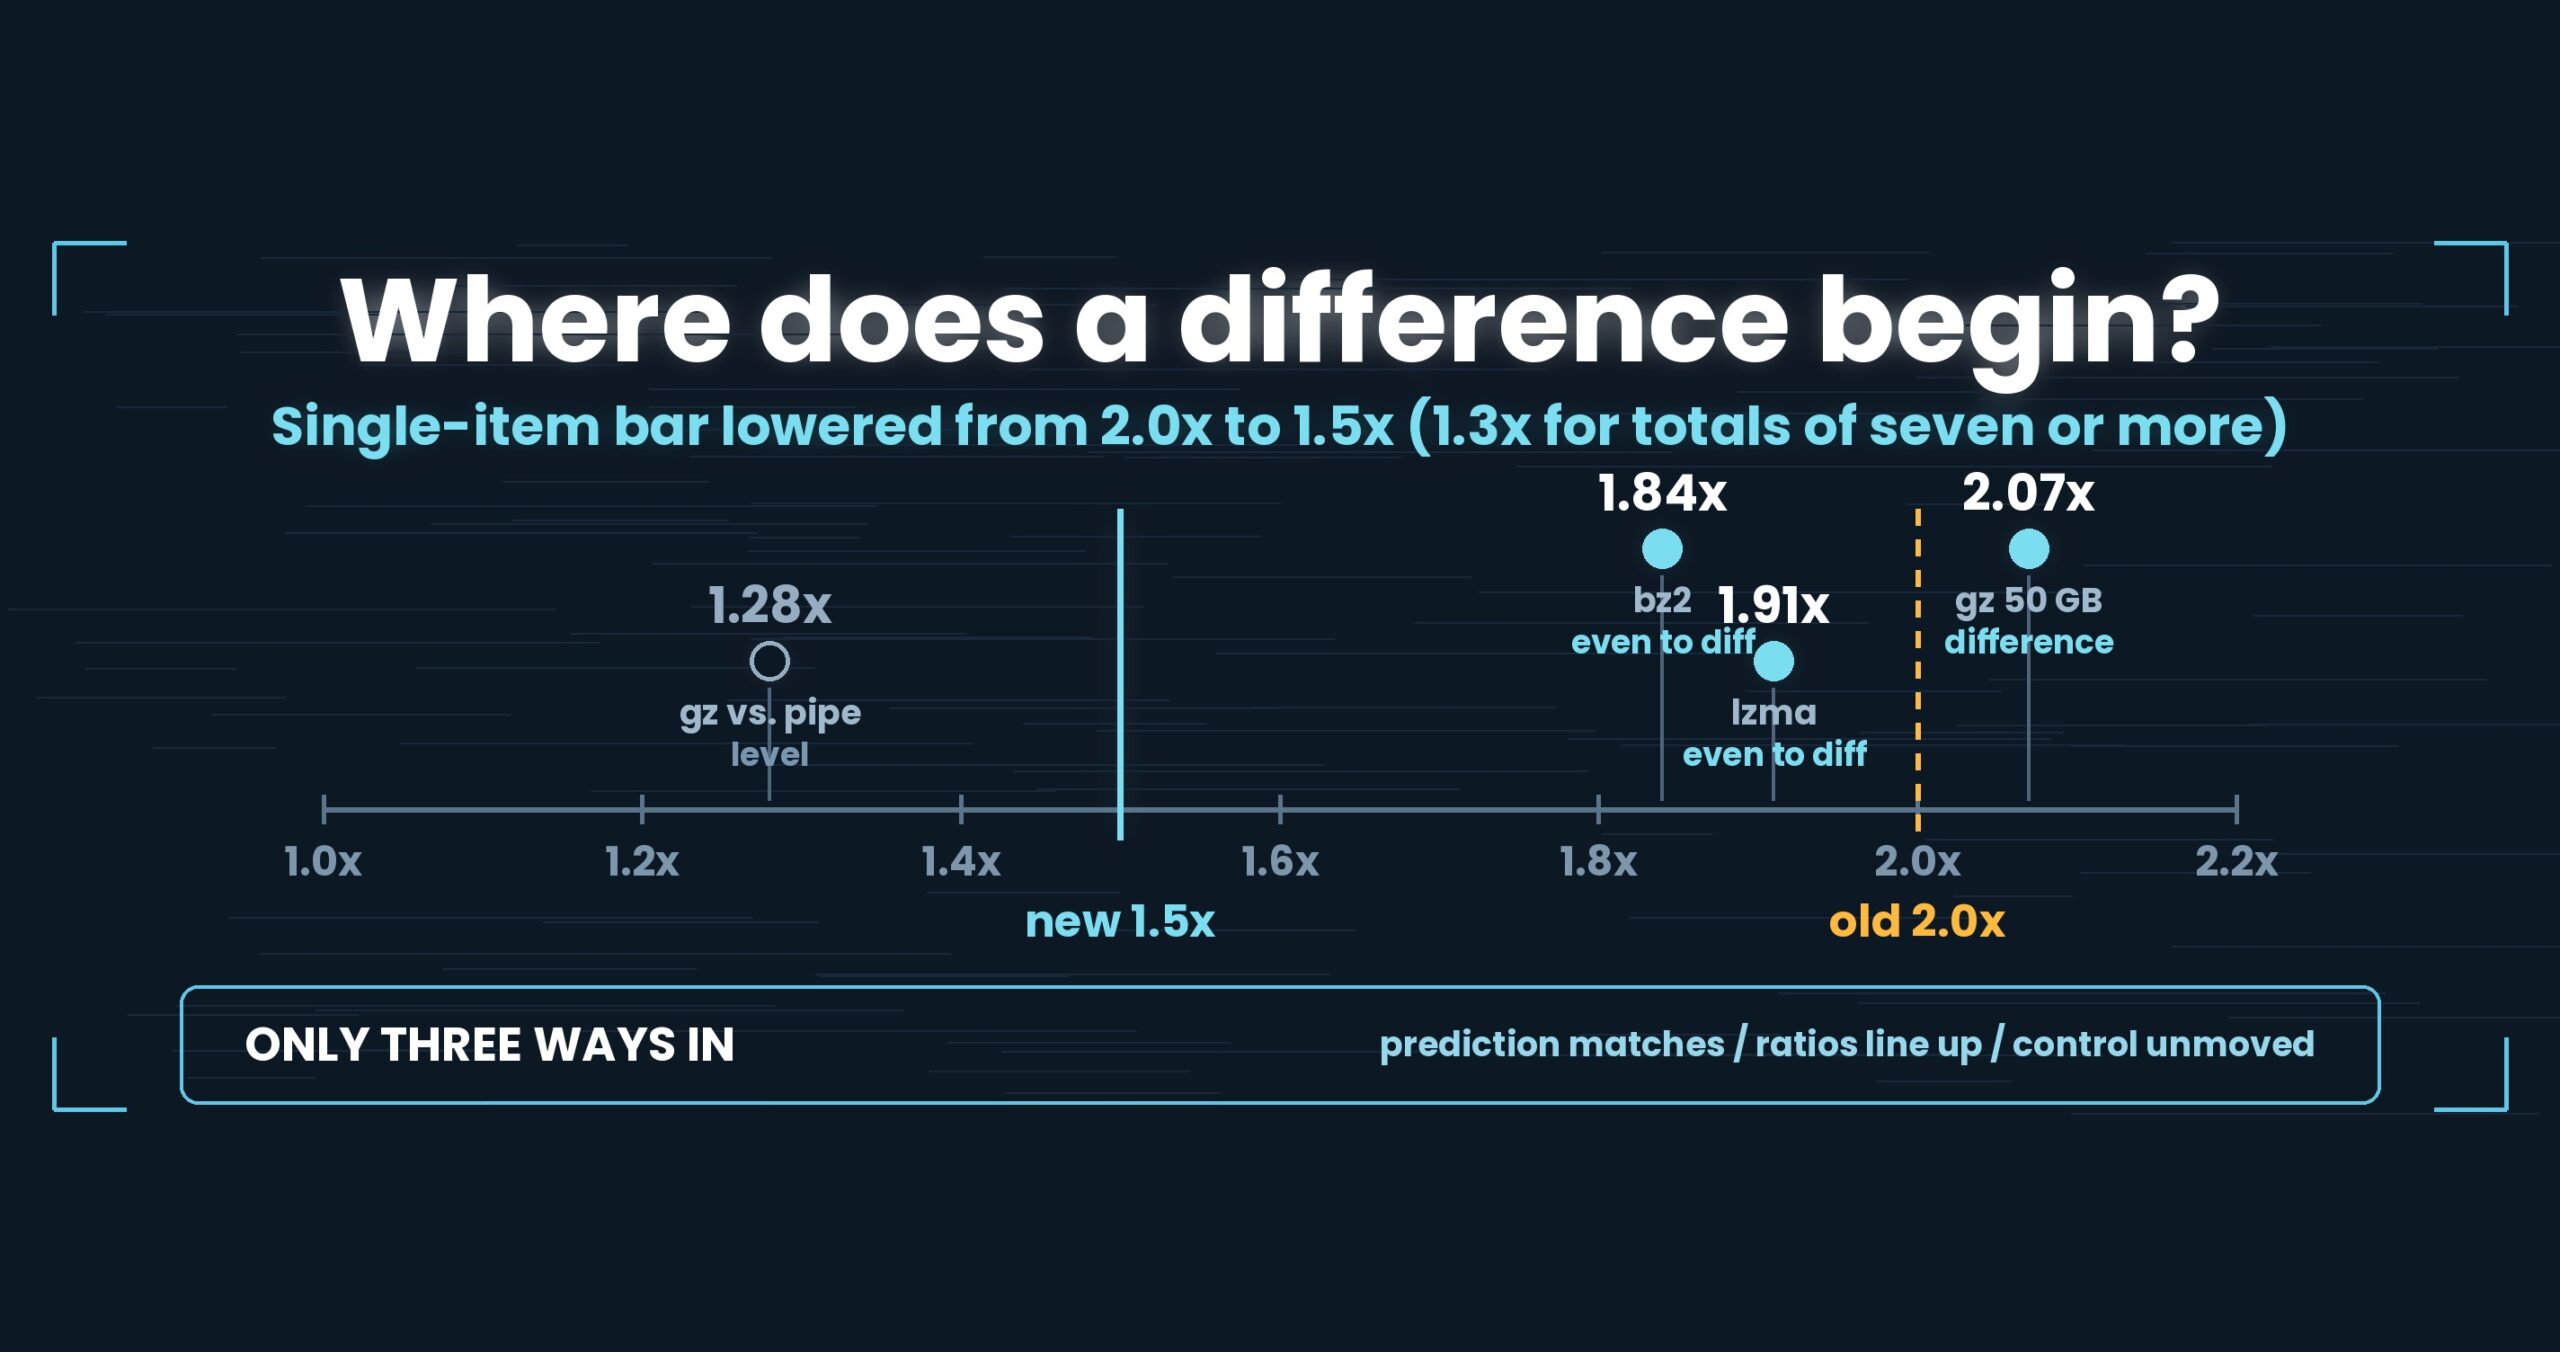
We fixed our comparison rules in prose, before running the benchmarks: nothing under 1.5× counts as a difference on a single item; nothing under 1.3× counts on a total of seven or more items; below that, a result counts only with independent corroboration — a prediction that matches the measurement, ratios that line up across file sizes, or a control group that does not move. The single-item bar used to be 2×; on 2026-09-25 we lowered it to 1.5×. Lowering it flipped six rows of our own compression measurements from “even” to “a difference”, and forced us to correct two sentences in published documents. This part is about the rules, so nothing got faster in it. Mac M4, 32 GB RAM, external USB SSD, OpenStreetMap XML; one setup, results vary. Details at the end.
About this series. “First Light” is the pet name of UwView v1.6.6 — the release where both the GUI and the command line
started opening and searching a huge file in a single pass. This series follows what that took, one fix at a time.
Every number in the other parts has been through the rules described here.
The problem: a benchmark number can be read whichever way suits you
Keep doing performance work and you reach this moment.
You made a change. You measured. It is 1.3× faster. Is that a result, or is that noise?
The awkward part is that both readings are available. Run the same command three times and you get three numbers; an external USB SSD swings a second either way without trying. So the instant you see 1.3×, you can pick the explanation you prefer.
- if you wanted it to work, you read “it worked”
- if you are skeptical, you read “noise”
And neither person is lying. There is no rule.
For someone writing articles about their own tool, that ambiguity is fatal. The competition — ripgrep, klogg — does not show up to object. The only material a reader has for checking your claim is the numbers you chose to publish. All the interpretive freedom sits on the author’s side, and if you keep spending it in your own favor, what you end up with is a pile of articles nobody can trust.
So: can you decide where “a difference” begins before you look at the measurement?
The fix: three rules, parked inside the performance report
Here are the three:
- Under 1.5× is not a difference on a single item (one measurement, say “ignore-case search over 50 GB”)
- Under 1.3× is not a difference on a total of seven or more items (summing cancels individual scatter, so the bar can come down)
- Below that, one piece of independent corroboration promotes it to a difference. Only three things qualify
- a prediction that matches: before the fix, write down in seconds what you expect to save — and the measurement lands there
- ratios that line up across sizes: 3 GB, 10 GB and 50 GB give the same ratio (noise scatters them)
- a control that does not move: the untouched comparison tool returns the same seconds as before
Rule 3’s phrasing is the load-bearing part. “Exceptions allowed with corroboration” permits infinite exceptions. Enumerating the acceptable kinds of corroboration and refusing everything else is what makes the escape hatch usable but finite. In particular it retires the reason “well, it feels like it helped”.
We also fixed where they live. The three rules are not in an article; they are a section titled “criteria from here on” inside the performance report. Judgment lives next to the measurements, and articles cite it — rather than each article trying to remember.
Where it actually mattered: all three kinds got used
Since adopting the rules we have used each kind of corroboration once. They map onto parts of this series.
(1) Ratios lining up across sizes — direct gz search (Part 8 of this series)
| original size | before | after | ratio |
|---|---|---|---|
| 3 GB | 2.18 s | 1.16 s | 1.88× |
| 10 GB | 7.27 s | 3.66 s | 1.99× |
| 50 GB | 35.65 s | 17.20 s | 2.07× |
All three clear 1.5× on their own, so they pass regardless. The 1.88 / 1.99 / 2.07 alignment still carries information: it is the shape you get from removing a stage that cost a fixed fraction of every byte, which is exactly the claim being made.
(2) A control that does not move — the JIT setting (Part 7 of this series)
Seven warm-cache searches at 3 GB: 11.46 s → 7.95 s, or 1.44×. That misses the single-item bar of 1.5×, but a seven-item total is judged at 1.3×, so it passes. On top of which, on the same machine in the same session, ripgrep did not budge from 7.81 s. If one side moves and the other does not, “the environment drifted” is no longer available as an explanation.
(3) A prediction that matches — riding along with the index
This is the one we like most. During investigation we had decomposed the first query over 50 GB like this:
- building the index (
.uwvz): 58.6 s - re-reading the finished index to search it: 6.8 s
- total: 65.5 s
And we wrote down, in advance, that searching while building should erase that 6.8 s. After implementation the measurement went 65.7 s → 59.04 s: 6.7 s removed, against a prediction of 6.8 s.
That agreement licenses a much stronger claim than “it got faster”. It is evidence that our model of where the time went was correct. Conversely, had only 3 s disappeared, the stage we thought we deleted must overlap something else, and that is now the thing to investigate. Writing the prediction first means a miss also teaches you something.
Lowering the bar from 2× to 1.5×
Until recently the single-item bar was 2×. On 2026-09-25 we lowered it to 1.5×.
Why lower it: 2× was strict enough to discard real improvements. Work bound by disk reads cannot produce 2× at all — the media bandwidth is the ceiling, so making the CPU faster moves nothing. That is precisely the structure behind uvf moving 1.2% in Part 7. In that world, “ignore anything under 2×” leaves almost nothing to look at.
What lowering it costs, stated plainly: the 1.5–2.0× band moves from “even” to “a difference”, so we catch more real effects and also more false ones. Something like 1.6× can appear from nothing but a difference in free disk space or cache state. So the lower bar raises how often we go looking for rule-3 corroboration. Lowering a threshold is a promise to corroborate more.
Six rows of our own work flipped
Change the bar and old verdicts move with it. In our compression-format measurements, six rows (seven values) went from “even” to “a difference”.
| item | ratio | old verdict (2× bar) | new verdict (1.5× bar) |
|---|---|---|---|
| bz2, paid build | 1.84× | even | a difference (we are faster) |
| lzma, paid build | 1.91× | even | a difference (we are faster) |
| plaintext, paid build | 1/1.51× | even | a difference (we are slower) |
| mixed set A, paid build | 1/1.55, 1/1.53× | even | a difference (we are slower) |
| mixed set B, free build | 1/1.57× | even | a difference (we are slower) |
| same, separate run | 1/1.85× | even | a difference (we are slower) |
Four of the six fell on the side where we lose. Lowering the bar was not an exercise in collecting flattering numbers.
We also corrected two sentences in published documents:
- “all seven formats are even with ripgrep’s compressed-input support (all under 2×)” → no longer writable. bz2 at 1.84, lzma at 1.91 and plaintext at 1/1.51 are differences under the new bar
- “read through our honesty rules, every format is ‘even'” → corrected for the same reason
The method of correction is also a rule now. We do not rewrite cells in measurement tables. They stay as what was measured, and we append a dated list at the top of the document saying which verdicts this bar change flips. Rewriting cells destroys the record of what was measured when and how it was judged. Numbers are the record; verdicts are interpretation — store them mixed together and you can no longer revise only the interpretation.
The environment breaks before your judgment does
The thing we did not expect: broken measurements are far more common than borderline verdicts. Three we actually walked into.
- Free disk space made only the output-heavy searches look 2× slower. Invert search (
-v) emits millions of lines, so a nearly full disk stalls the write side. The search had not got slower; writing had. We thought we were comparing reads and were measuring writes - ripgrep’s warm-cache number at 10 GB was anywhere from 11 s to 3 s depending on free memory. Same command, same file, same build. “Hot” is not a state you can assert in one word; it is a continuous quantity — how much of the file is still resident. Without pinning that, warm comparisons do not mean anything
- A number faster than the raw read bandwidth means redo it, not celebrate it. We once recorded 250.68 s on a 258 GB file. Computed from the media’s sequential read, nothing can be faster than a certain floor. After
sudo purgeand a rerun: 265.21 s. A number that beats physics is evidence of a measurement error, not of speed
What these share is that none of them is about the threshold. Before arguing 1.5× against 2×, you have to establish what those seconds measured. Pin the environment first; apply the criteria second.
Being straight about it
- These rules are ours, not an industry standard, and not a statistical test of significance. We judge on ratios without collecting distributions, so we are strictly weaker than a proper test. We do not have the run counts a test would need
- Some items are thinly sampled. The count nondeterminism in Part 5 rests on three runs. Three is weak evidence for “it varies”; more runs is the right answer
- The move to 1.5× happened on 2026-09-25. Articles published before that still carry wording written against the 2× bar. We are aligning the stated threshold without changing any number or conclusion
- The rules are about ratios. Absolute values need separate judgment: 0.2 s to 0.1 s is 2× and nobody notices, while 250 s to 200 s is 1.25× and called “even” but matters a great deal to whoever is waiting
- We do not compare seconds across operating systems. Windows and Linux figures are quoted only as ratios within their own OS
The general lesson: criteria can only be written before the result
There is no clever engineering in this part. It is in the series because every number in the other parts rests on it.
Three points.
(1) Write the criteria before the measurement. Start deciding “is this a difference?” after seeing the result and the answer bends toward what you were hoping for. No bad faith is required. When 1.3× supports both “it worked” and “that’s noise”, a human picks one. Only a rule written earlier prevents that choice.
(2) Decide how exceptions are made before you need one. “Exceptions with corroboration” is too loose. Enumerate the acceptable kinds and refuse the rest, and the hatch stays usable without widening. Ours are prediction-match, ratio-alignment, and unmoved-control — chosen because each one puts the judgment outside your own head.
(3) When the bar changes, re-examine old verdicts and leave the records alone. Lower the bar and ignore the back catalogue, and one document ends up carrying two standards. Rewrite the measurement cells to the new bar and the original measurement is gone. Keep the cells, append the date and the list of flipped verdicts — that was the only way to preserve both.
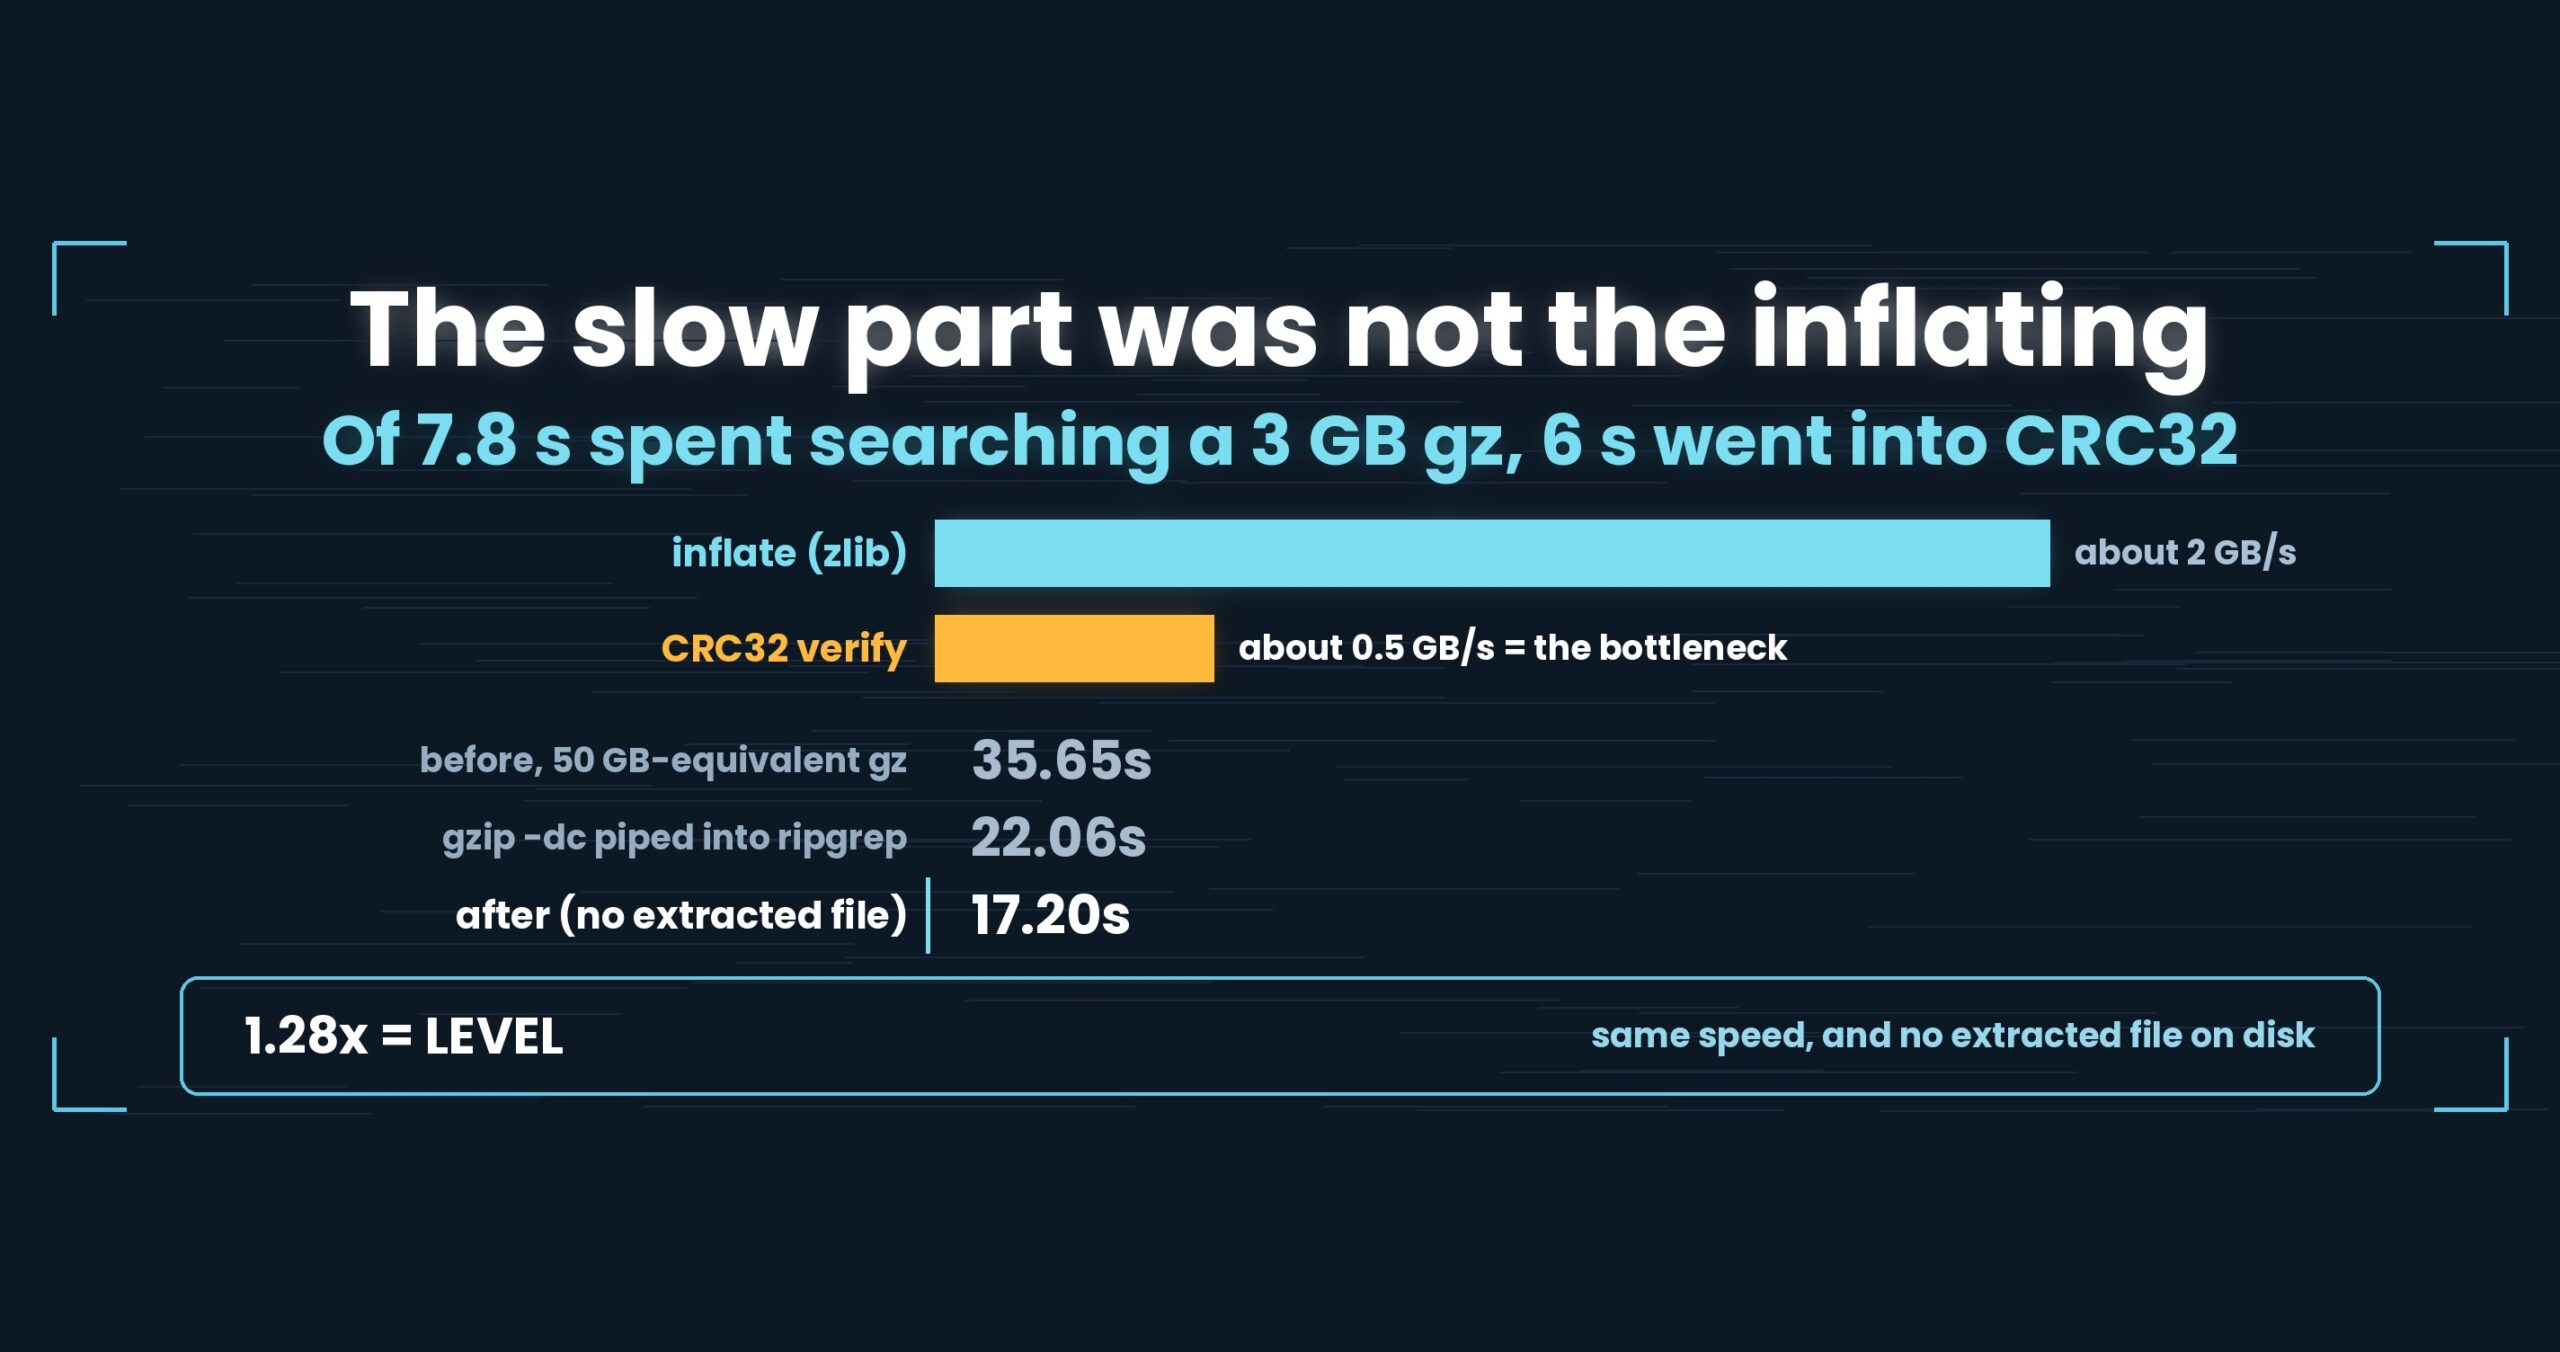
Finally, the moment the rules earned their keep: throwing away a number that favored us. In Part 8, against gzip piped into ripgrep at 22.06 s, we measured 17.20 s. That is 1.28×. It is very tempting to write. But the bar is 1.5×, so the most we get to write is “level”.
Whether we can hold that one line is, I think, what sets the price of every other number we publish.
The tools behind this
UwView is a viewer for huge text and huge logs (free: UwView; paid: UwView Pro).
The same things, from the command line
If you want to re-measure on your own hardware, the minimum discipline is run the same command twice and record the two runs separately.
# Ch.3: separate the first query (builds the index) from the second (uses it)
/usr/bin/time -p uvp huge.log 'ERROR' > /dev/null
/usr/bin/time -p uvp huge.log 'ERROR' > /dev/null

# Ch.5: keep output volume out of the measurement — write to a file or /dev/null
uvp huge.log 'ERROR' -out hits.txt

# Ch.6: output-heavy conditions (invert) can become write-bound
uvp huge.log 'ERROR' -E 'health|ping'

# Ch.6: confirm you emit the same lines as the other tool (before comparing speed)
uvp huge.log 'ERROR' -out mine.txt
rg 'ERROR' huge.log > theirs.txt
Exit codes match grep: 0 = found, 1 = not found, 2 = error or incomplete result. We discard timings from runs that exited 2 — seconds from a truncated run are not comparable with seconds from a complete one.
Honestly: the first query with uvp is a little slower than ripgrep, because it builds the .uwvz (compression + index) first — at 50 GB, 59.0 s vs. 54.9–55.8 s = 6–7% (v1.6.6.1). It pays off from the second query on: the same 50 GB search returns in 6.56 s, about 8.4× ripgrep. On small files like 3 GB it is about even — the index buys you less. The free uvf is on par with ripgrep at any size (measured article; Mac M4, 32 GB RAM, external USB SSD, OpenStreetMap XML — one setup, results vary).
Links
- Part 1 — the day we wrote “this is not a speed tool”: https://uvp.y42u.net/en/blog/uwview-fl01-v160-confession-en/
- Part 5 — three different counts from one command: https://uvp.y42u.net/en/blog/uwview-fl05-deterministic-count-en/
- Part 6 — handing the CLI’s results to the window: https://uvp.y42u.net/en/blog/uwview-fl06-cli-to-gui-handoff-en/
- 81 checks against ripgrep and sed, line by line: https://uvp.y42u.net/en/blog/uvp-vs-ripgrep-sed-81-checks-en/
- Splitting 50 GB into three separate arenas: https://uvp.y42u.net/en/blog/uvp-three-arenas-50gb-en/
- Source (GitHub): https://github.com/amru195704/UwView
And if huge logs are eating your storage and you want them kept compressed and still searchable, try UwView Pro: a persistent index, search inside the compressed cache, and about 1/9 the storage, with reopening and searching both a step faster (all OSes; one-time purchase or subscription).
From the developer: a list of my apps, Kindle books, and open source is at GitHub: amru195704.