All you have is 14:07.
That’s the whole report. No error message, no request ID, no reproduction steps.
A few hundred million lines of log, and one timestamp. How long until you’re standing at the scene?
The first fact you get in an outage is almost always when. And a timestamp is one of the very few attributes that nearly every line in a log shares. A timestamp isn’t a search term — it’s a coordinate. That’s where this article starts.
What follows are four ways of reading a log through its clock: jumping to one minute, absorbing skew between servers, seeing anomalies in the spacing between lines, and reconstructing one user’s timeline. Each has a workable answer in grep and awk. And all four stop on the same three operations.
- Up front: UwView Pro scrolls a 258.68 GB, 4.5-billion-line file from the moment it opens — and from the second open onward it opens with line numbers, so you can go straight to the line at that time (measured on one setup; details at the end)
- 1. When “14:07” is all you have, and the file is hundreds of millions of lines
- 2. The servers disagree about what time it is
- 3. The symptom is in the spacing, not the content
- 4. One user’s entire timeline, out of tens of millions of requests
- What all four had in common
- The tool I use
- Links
Up front: UwView Pro scrolls a 258.68 GB, 4.5-billion-line file from the moment it opens — and from the second open onward it opens with line numbers, so you can go straight to the line at that time (measured on one setup; details at the end)
1. When “14:07” is all you have, and the file is hundreds of millions of lines
Situation
Make that 14:07 concrete. A single day’s log, a few hundred million lines, tens of gigabytes. The timestamp sits at the start of each line and — of course — the file is in ascending order.
You want the lines around 14:07. Less than 0.001% of the file. What do you currently do to see just that?
Why it happens
The log is perfectly sorted by time, and a text file has no index from time to position.
Search on sorted data should be a binary search. A few hundred million lines is about thirty comparisons. But a text file carries no record of where line boundaries are, and the byte offset of line N is unknowable without counting from the top. That one fact takes the best available tool off the table.
There’s a second wrinkle: the timestamp you want may not literally appear. 14:07:33 might be in the file while nothing happened at 14:07:00 at all. Gaps in the seconds are entirely normal. What you actually want isn’t “the line at that time” — it’s the position that straddles that time.
Command-line triage, and where it stops
The obvious move is grep.
grep -n '14:07:' app.log | head           # hits in that minute, with line numbers
sed -n '/14:07:00/,/14:09:00/p' app.log   # cut a time range
awk '$0 >= "2026-09-01 14:05" && $0 <= "2026-09-01 14:10"' app.log
The third one is the classic: when lines start with YYYY-MM-DD HH:MM:SS, string comparison is time comparison. No parsing, and reliable as long as the format is uniform.
A smarter approach exploits the sort order.
# Count the lines, then probe a guessed position (binary search by hand)
wc -l app.log
sed -n '148000000p;148000001p' app.log
This genuinely works. A few rounds and you’re in the right minute.
It stops in three places. First, every one of those commands re-reads the original from the top. grep, sed -n 'range p', and awk all scan every byte up to your target, no matter what percentage of the file it sits at. At tens of gigabytes, that’s tens of seconds a shot. The strongest clue you have — that you know the time — is doing no work at all.
Second, the manual binary search is undone by its own first step: wc -l is itself a full read, and sed -n 'Np' counts from the top again, so each probe costs another pass. The theoretically optimal method loses on execution cost.
Third, you can’t move once you arrive. You’re reading the range sed cut for you, you think “I want the minute before that too” — rewrite the range, full read again. In an outage, the right window is never right on the first guess.
2. The servers disagree about what time it is
Situation
The web server log shows a request at 14:07:12. The API server log shows the corresponding handler starting at 14:07:09. It started before it was called.
That isn’t time travel; it’s almost certainly clock skew. So: how many seconds, and in which direction?
Why it happens
Each server keeps its own clock, and nothing guarantees they agree.
Even under NTP there is always sub-second drift. If sync has lapsed, it’s seconds; if a VM or container host has been under load, more. And the skew isn’t constant — when NTP corrects in a step, the relationship changes at that instant.
There’s a second, very common variant: mixed time zones. The application logs in local time, the container logs in UTC, the middleware writes an explicit offset. A whole-hour difference is obvious enough to spot — which is exactly why mechanically “adding the offset” is dangerous. It quietly bakes in a different error (a rotation boundary landing on the wrong day, for instance) that nothing will flag.
And here’s the heart of it. What you want from a reconciliation isn’t absolute time — it’s which happened first. When the skew is three seconds, the order of two events less than three seconds apart is not recoverable in principle. What you can establish is the order of events separated by comfortably more than the skew.
Command-line triage, and where it stops
Measure the skew first. The standard trick is to find one event that appears on both sides.
# Compare timestamps for the same work via a correlation key
grep 'req-8f21ac' web.log api.log
# Or calibrate on an event that is genuinely simultaneous
grep -h 'application started' web.log api.log
Then shift one side and merge.
# Add 3 seconds to the API log, then interleave with the web log
awk '{ ... convert the timestamp to epoch, add 3, write it back ... }' api.log > api.shifted.log
sort -m -k1,2 web.log api.shifted.log | less
That is the correct procedure. And the procedure itself brings three problems with it.
First, the moment you correct it, it isn’t the original. Which line of api.log is line 4,120,338 of api.shifted.log? The same one, if nothing was added or dropped — and the only thing guaranteeing that is your own care. When you write “API server log, line 4,120,338” in an incident report, that number belongs to a derived file. The “don’t touch the original” principle from part 4 breaks right here.
Second, every revision of the skew estimate restarts everything. “I assumed three seconds, but the calibration event was a poor choice — maybe it’s 2.4.” Read tens of gigabytes, rewrite, re-merge. And the merged file costs you double the disk.
Third, merging collapses two things into one. Once it’s a single stream, you lose track of which server each line came from. What you wanted was the two files side by side, scrolled to the same window of time. The same shape appeared in part 6 with DHCP lease logs: reconciliation is fundamentally juxtaposition, not synthesis.
An honest note: there is no method that fully recovers the ordering of two logs whose clocks differ by seconds. All you can do operationally is estimate the width of the skew and decline to assert any ordering finer than that width. “Simultaneous, within a ±3 s clock difference” in a report is more accurate than a single timeline you forced into existence.
3. The symptom is in the spacing, not the content
Situation
The service gets slow every few days. Nothing errors. The content of the log is entirely normal, and grep ERROR returns nothing.
Memory leaks and connection leaks, early on, show up as slowness rather than as errors. And slowness shows up in the intervals between lines.
Why it happens
The anomaly lives in the distribution of write times, not in what was written.
Take a health check that logs once a minute. Healthy, the lines sit 60 seconds apart. As GC pauses lengthen, they go to 61, 63, 67 — and then snap back to 60 (a restart). No single line can tell you any of this. Every line reads health check ok.
The same thing happens in the other direction. When a retry storm starts, the intervals compress: hundreds of identical lines in one second. Also perfectly normal, line by line.
So what you want to see is a change in the arrangement of lines, not a set of lines. And because that change begins somewhere, you can’t know in advance where to look. You need to take in the whole shape, then move toward the part that looks different.
Command-line triage, and where it stops
Computing deltas is awk‘s home ground.
# Print the gap to the previous line, show only the large ones
awk '{ "date -d\""$1" "$2"\" +%s" | getline t; if (p) d=t-p; p=t; if (d>90) print d, $0 }' app.log

# Count per minute to see the density change
awk '{print substr($2,1,5)}' app.log | uniq -c | head -100
That second one earns its keep. Density comes out as a number, so a retry storm is obvious at a glance.
It stops in three places. First, both of these walk hundreds of millions of lines one at a time. The first is hopeless as written (a date fork per line — in practice you hard-code the format and convert to epoch yourself), and even the second takes minutes at tens of gigabytes. Every time you wonder whether the threshold should be 120 instead of 90, that’s another few minutes.
Second, turning it into numbers throws the context away. Knowing “the 14:07 bucket has 3× the usual count” doesn’t tell you what those lines are. You go back to the original and search for 14:07 — which is section 1’s full read all over again.
Third, and most fundamentally: “look at the spacing” is a job for a graph or for your eyes. Setting a threshold and printing what exceeds it only works when the threshold is already right. What you want first, in an outage, is to see the shape of something whose anomaly you can’t yet describe. Quantifying comes after you’ve seen the shape, not before.
4. One user’s entire timeline, out of tens of millions of requests
Situation
“Show me everything this account did on September 1st.” It comes up in support, in fraud investigation, and in audits.
The API response log is tens of millions of lines a day. One user is dozens to a few thousand of them. What’s being asked for is the story of what that person did, not a pile of matching lines.
Why it happens
One person’s activity is spread thinly across the whole timeline.
A few hundred lines out of tens of millions is 0.001%. And crucially, those few hundred lines are not contiguous — they’re interleaved with everyone else’s, scattered through the entire file.
On top of that, one person has several identifiers: user ID, session ID, API key, device ID, source IP. Different logs carry different ones, and connecting them into “the same person” is human work. The session ID only appears on the line right after login, so you find that first and then go searching again.
And finally: once it’s in order, you’ll want to narrow it further. The full set turned out to be a few thousand lines. Now just the errors. Now just the POSTs among those. You can’t know which filters you need until you’ve seen the result.
Command-line triage, and where it stops
The natural progression looks like this.
grep 'user_id=U8842' api.log > u8842.log            # pull one user out
grep -o 'session=[a-f0-9]*' u8842.log | sort -u     # collect their session IDs
grep -E 'user_id=U8842|session=(a1b2|c3d4)' api.log | sort -k1,2 | less   # re-extract with the extra identifiers
grep 'status=5' u8842.log | grep 'POST'             # narrow what you extracted
This flow is correct, and it does finish the job.
It stops in three places. First, every identifier you add sends you back to the original. Adding session= in the third command is another full read of tens of gigabytes — and identifiers essentially always accumulate mid-investigation.
Second, the intermediate file has no line numbers. Nothing records that line 310 of u8842.log is line n of the original. The moment you want to know “what was someone else doing immediately before this failure” — which comes up in every contention or lock-wait investigation — the intermediate file is useless, because it contains only this user’s lines. You need to be back at that line in the original, and the way back is gone.
Third, the narrowing in that fourth command stacks up. Chain grep | grep | grep and you never see how many lines each stage removed. It’s the same “no per-stage counts” problem described in part 6.
What all four had in common
| Reading | How the clock is used | The operation you wanted | Where it stops |
|---|---|---|---|
| Jump to one minute | Time as a coordinate in the file | Go straight from a time to a position | Sorted, yet no binary search — every attempt is a full read |
| Absorb clock skew | Time as the axis that aligns two files | Align two originals without mixing them | Correcting makes it derived; merging erases which file it came from |
| Read the spacing | Time as the gap between lines | See the whole shape, then move in | Numbers discard context; each new threshold is another full read |
| One user’s timeline | Time as the sort key | Stack the narrowing, keep the position in the original | Each new identifier is a full read; intermediates lose line numbers |
None of these are blocked on analysis technique. Look at the third column and the operations collapse into three.
- Go from a timestamp straight to a position in the original. Time is the one sorted key nearly every line carries. Used as a coordinate, a few hundred million lines still means a few hundred lines to actually read.
- Align several originals without mixing them. Reconciliation is juxtaposition. The moment you merge, you lose which original you’re looking at.
- Look at how lines are arranged, not what they say. Spacing, density, order. Anomalies often live in how something was written, not in what was written.
All three are things anyone does without thinking on a small file. Search for a datetime in an editor and jump to it. Put two windows side by side. Scroll and notice that the lines bunch up here. At tens of gigabytes, jumping demands a full read, aligning demands a derived file, and looking demands a wait of minutes.
This shape has recurred throughout the series: part 1‘s tools that demand a full read before showing anything, part 2‘s round trip between the hit list and the scene, part 5‘s “normalize it and you can’t get back.” The operations aren’t hard; size is what stops them being worth their cost — even when you’re holding the single strongest clue a log can offer.
Back to “all you have is 14:07.” Having one clue isn’t a bad position at all. A timestamp is the most trustworthy index in a log. The problem is with tools that won’t let you use it as one.
The tool I use
UwView (free), which I develop, is a viewer built to remove the assumption that size takes the clock away from you. A log of tens of gigabytes displays, scrolls, and searches from the moment it opens; the index is built in the background and line numbers appear when it completes. Fling the scrollbar to the middle of the file, read the timestamp you land on, adjust — the manual binary search that had you alternating wc -l and sed -n 'Np' in section 1 becomes a scrollbar drag.
Section 3’s spacing problem also starts with looking. Colour-highlight the minutes digit and scroll, and the change in density arrives as a change in the coarseness of the colour banding (how the colour highlighter works). Highlighting adds colour without removing lines, so the normal lines stay in view as the reference. Several files open at once, so section 2’s juxtaposition works without a merge. And it never writes to the original.
On top of that, UwView Pro strengthens exactly the three operations listed above.
- It saves the index and the compression. A log you’ve opened once opens instantly, with line numbers, from the second time onward. Outage work means reopening the same file over and over, so this is where it lands. With line numbers present, “go to line 4,120,338” costs no re-read — section 1’s “you can’t move once you arrive” disappears.
- Drill-down search: narrow a result list by another term, then another. Section 4’s
user_id → status=5 → POSTruns as tabs showingterm (count), so you see how many lines each stage removed and which filter did the work. From the second stage on, only the previous stage’s window is searched, so there’s no wait. Here’s the write-up. - Sequence search: match only where
w1 → w2 → w3appear in that order — useful for settling section 2’s “which came first” by position in the file rather than by comparing two clocks. One honest note: each stage searches the body from the previous stage’s position, so it takes about as long as a full-text search (unlike drill-down, where stages after the first are immediate). Here’s the write-up.
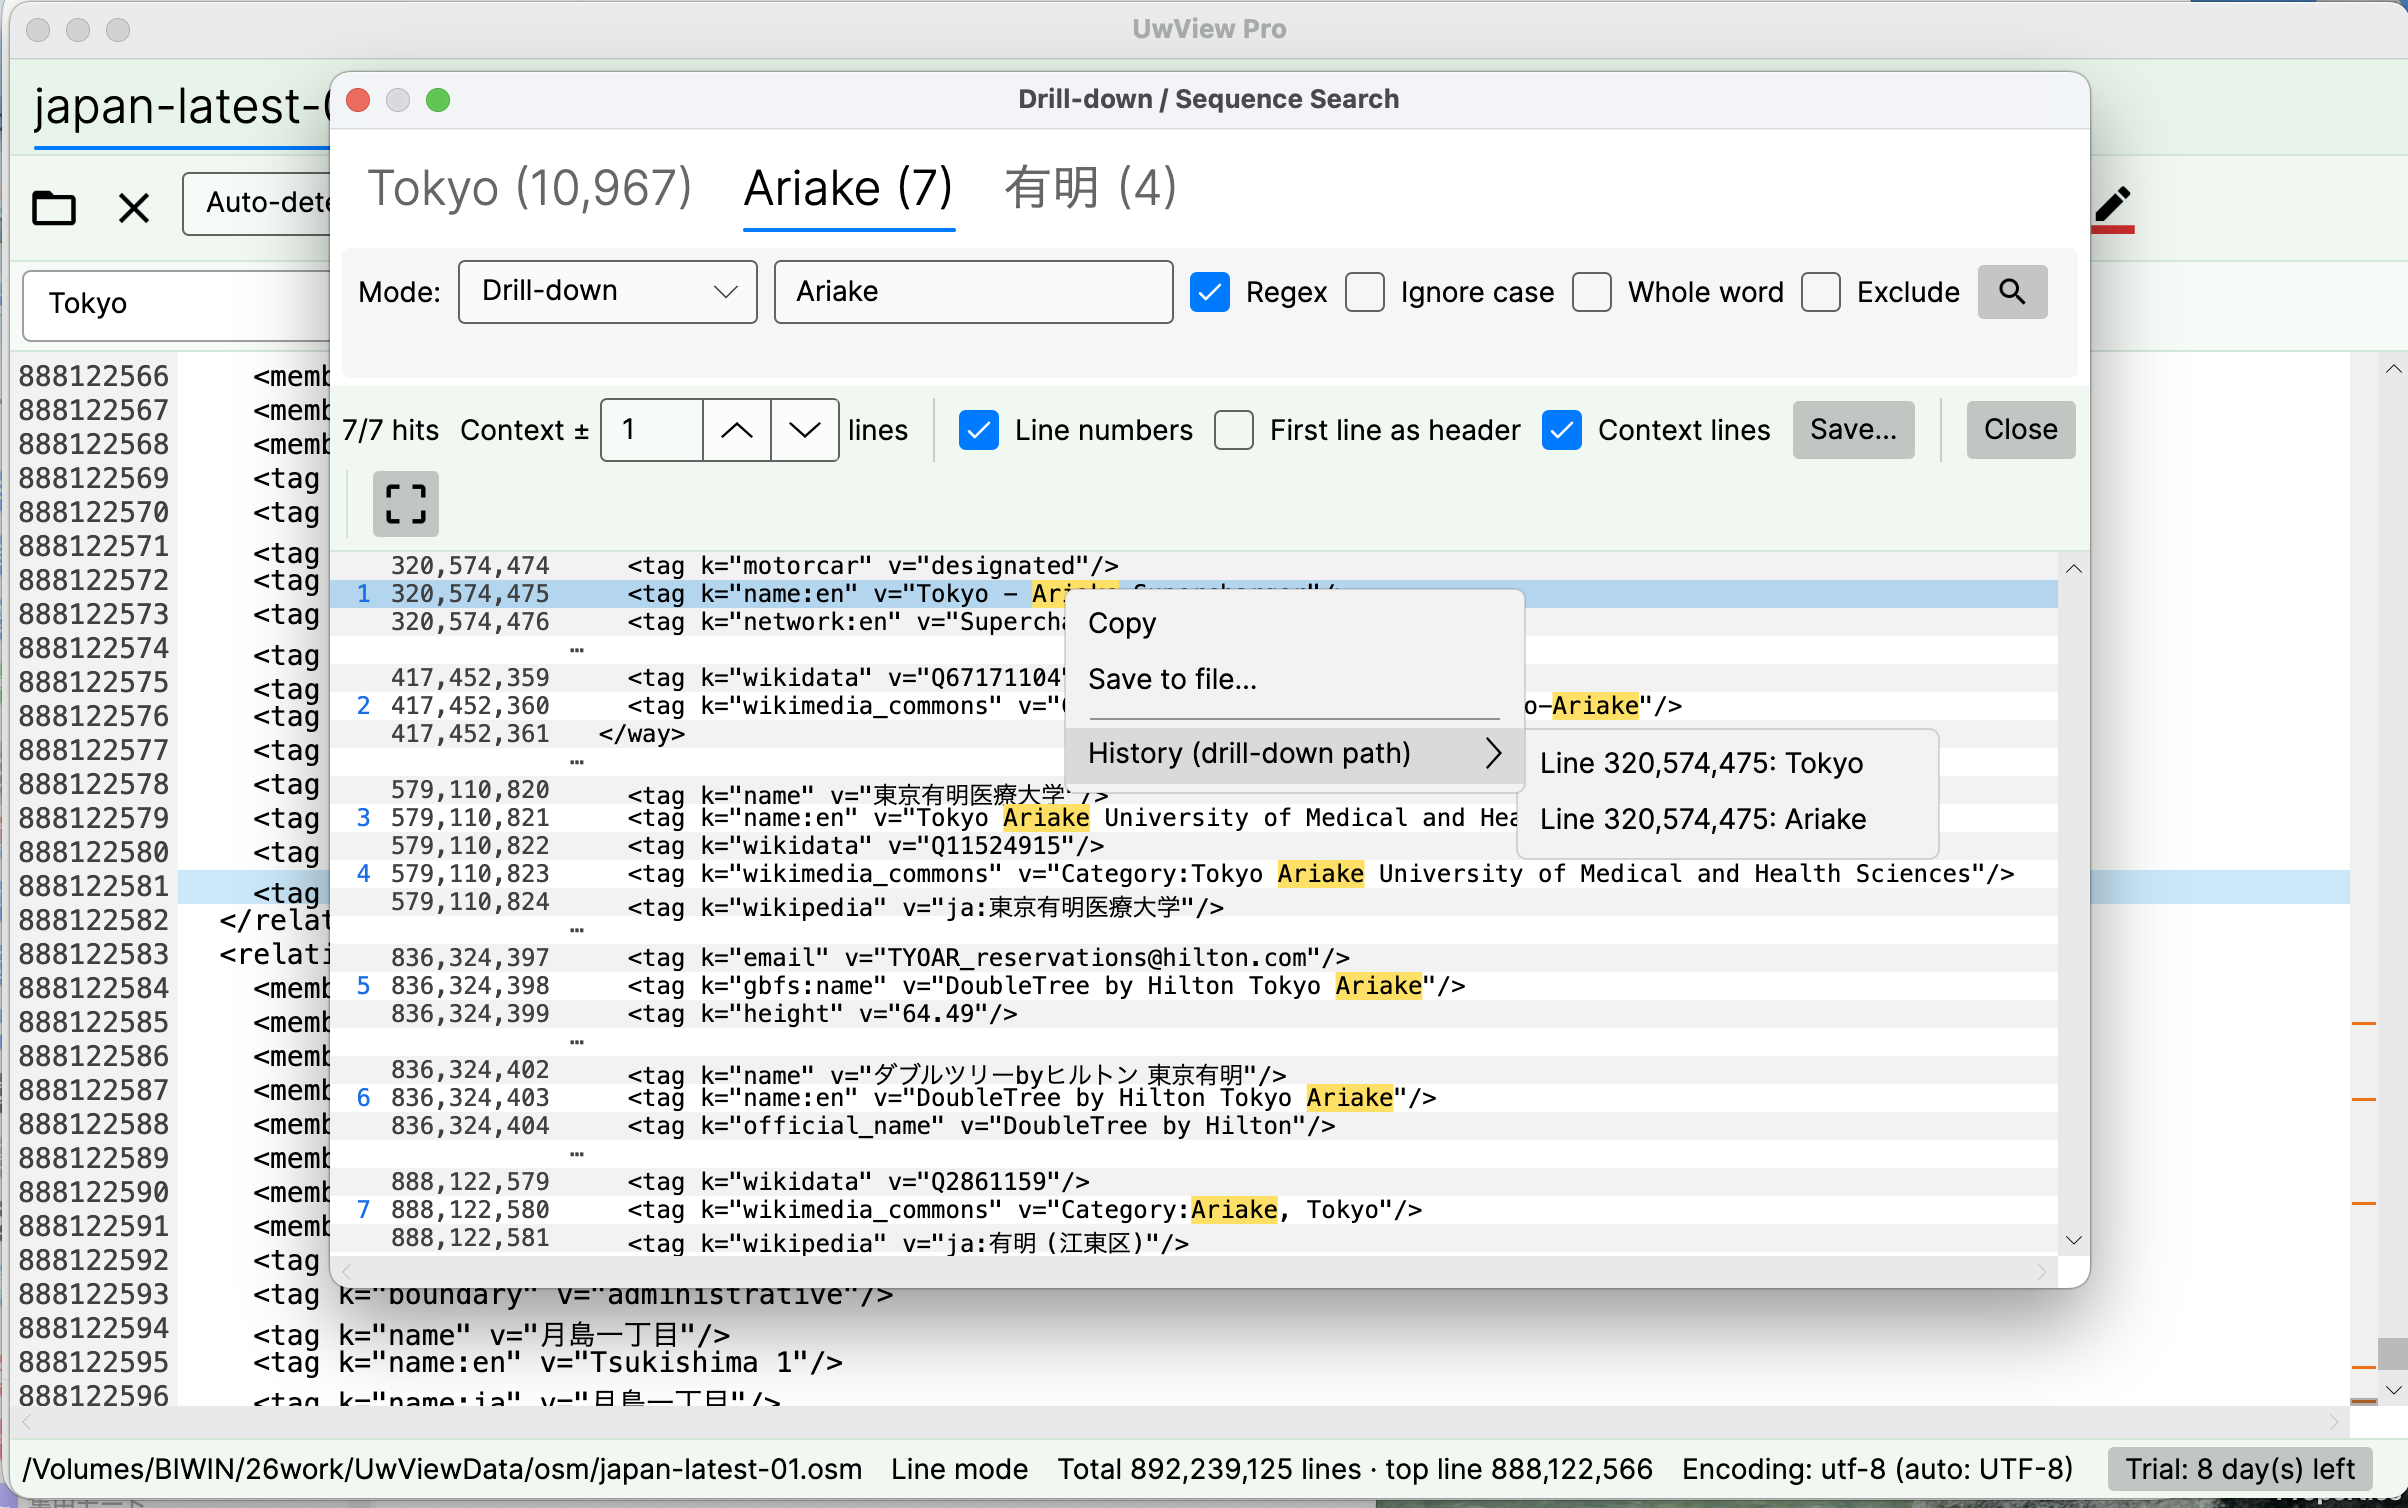
Stack a few stages and it stops being obvious why the row in front of you is on screen. Right-click and History (drill-down path) lists it: Line 320,574,475: Tokyo → Line 320,574,475: Ariake — term and original line number, in order — and you can jump into the body from any of them. A grep pipe keeps neither the per-stage counts nor the original line numbers. Timestamp-driven work is round trips, so a path that persists is the difference when the report has to be written.
And if a huge log is eating your disk and you want it compressed for storage while staying searchable at speed, Pro’s compressed-cache search and ~1/9 storage make both reopening and searching a step faster (all OS, one-time or monthly). The free UwView covers single-stage search with ±1 context and result export; drill-down, sequence search, the variable ±N, and the saved index are Pro features.
One honest limit: UwView does not interpret time. It doesn’t know that the string at the start of a line is a datetime, so you can’t ask it for “14:07 through 14:09” as a range, and it won’t correct clock skew for you. What it does is search for the timestamp text, jump to that position, colour it, and hold two files side by side. If you need time as a structure, that’s what a log platform or a SIEM is for. UwView covers the step before it — looking at the raw log, as it is, with your own eyes, before anything ingests it.
The same things, from the command line
v1.6.0 added a uvp command (and uvf for the free build). It uses the same .uwvz as the GUI, so an index built from the shell is already there when you open the file in the app. Mapped onto this article’s four parts:
# Part 1: land on the lines for "14:07", with original line numbers
uvp app.log '14:07:'

# Part 1, continued: hand it to the GUI and widen out from that position
uvp app.log '14:07:' -open

# Part 2: compare timestamps for the same work via a correlation key
uvp api.log 'req-8f21c0' -C 2

# Part 3: count per minute to see the density change
uvp app.log -uniq '^([0-9-]+ [0-9]{2}:[0-9]{2})' -head 30

# Part 4: one user's requests, narrowed by a second term and saved
uvp access.log 'user_id=90412' 'status=5' -out user-90412.txt
Exit codes are grep’s — 0 found, 1 not found — plus 2 when a limit is hit and the output is cut off (no limit by default; only when you set one with -limit N). if uvp app.log '14:07:'; then works as written, so part 2’s calibration — “does the same event appear in both logs?” — becomes a script.
Stated honestly: on the first question uvp is a little slower than ripgrep — it builds its .uwvz (a compressed cache plus index) first, 59.0 s against 54.9–55.8 s at 50 GB, 6–7%. In v1.6.6.1 it searches while building the index instead of re-reading it afterwards, which cut 6.7 s. It starts paying from the second question: the same 50 GB search takes 6.6 s against ripgrep’s 55–57 s — 8.4×. On a small file such as 3 GB the two are level, because an index has little to earn there. The free uvf is level with ripgrep at every size (the measurements; Mac M4, external USB SSD, OpenStreetMap XML — one setup, results vary). Timestamp-driven work returns to the same log again and again, which is exactly that shape.
Links
- Part 1: four go-to tools that sink under huge files: https://uvp.y42u.net/en/blog/uwview-ps01-huge-file-tool-limits-en/
- Part 2: four ways to trace causality in logs: https://uvp.y42u.net/en/blog/uwview-ps02-log-causality-tracing-en/
- Part 3: four character-encoding traps: https://uvp.y42u.net/en/blog/uwview-ps03-japanese-encoding-traps-en/
- Part 4: deciding between delete, keep, and compress: https://uvp.y42u.net/en/blog/uwview-ps04-log-retention-decision-en/
- Part 5: four ways to live with development logs: https://uvp.y42u.net/en/blog/uwview-ps05-debug-log-practices-en/
- Part 6: four steps through tens of millions of auth log lines: https://uvp.y42u.net/en/blog/uwview-ps06-intrusion-triage-auth-logs-en/
- Drill-down search — 94,979 hits down to 54 in two steps: https://uvp.y42u.net/en/blog/uvp-drilldown-search-en/
- Sequence search — finding only what appears in that order: https://uvp.y42u.net/en/blog/uvp-sequence-search-en/
- Chasing 5xx in an nginx access log: https://uvp.y42u.net/en/blog/uwview-access-log-5xx-workflow-en/
- How the colour highlighter works: https://uvp.y42u.net/en/blog/uwview-v11-color-highlighter-en/
- We shipped a
uvpcommand (measured against ripgrep): https://uvp.y42u.net/en/blog/uvp-cli-release-vs-ripgrep-en/ - Source code (GitHub): https://github.com/amru195704/UwView
From the developer: My apps, Kindle books, and public projects are listed at GitHub: amru195704.
A note
The information in this article is provided for reference and is not guaranteed to be accurate or complete. Log formats, field positions, and timestamp conventions vary widely by OS, middleware, and configuration. Command examples may need adjusting for your environment (GNU vs. BSD, your shell, theawkimplementation, the options yourdateaccepts, your log’s field layout, etc.). Clock synchronization state and time zone settings differ per system, so verify yours before reconciling logs. All user and session identifiers shown are fictional examples. If you find an error or inaccuracy, please point it out in the comments and it will be corrected after verification.