The small file was the one losing.
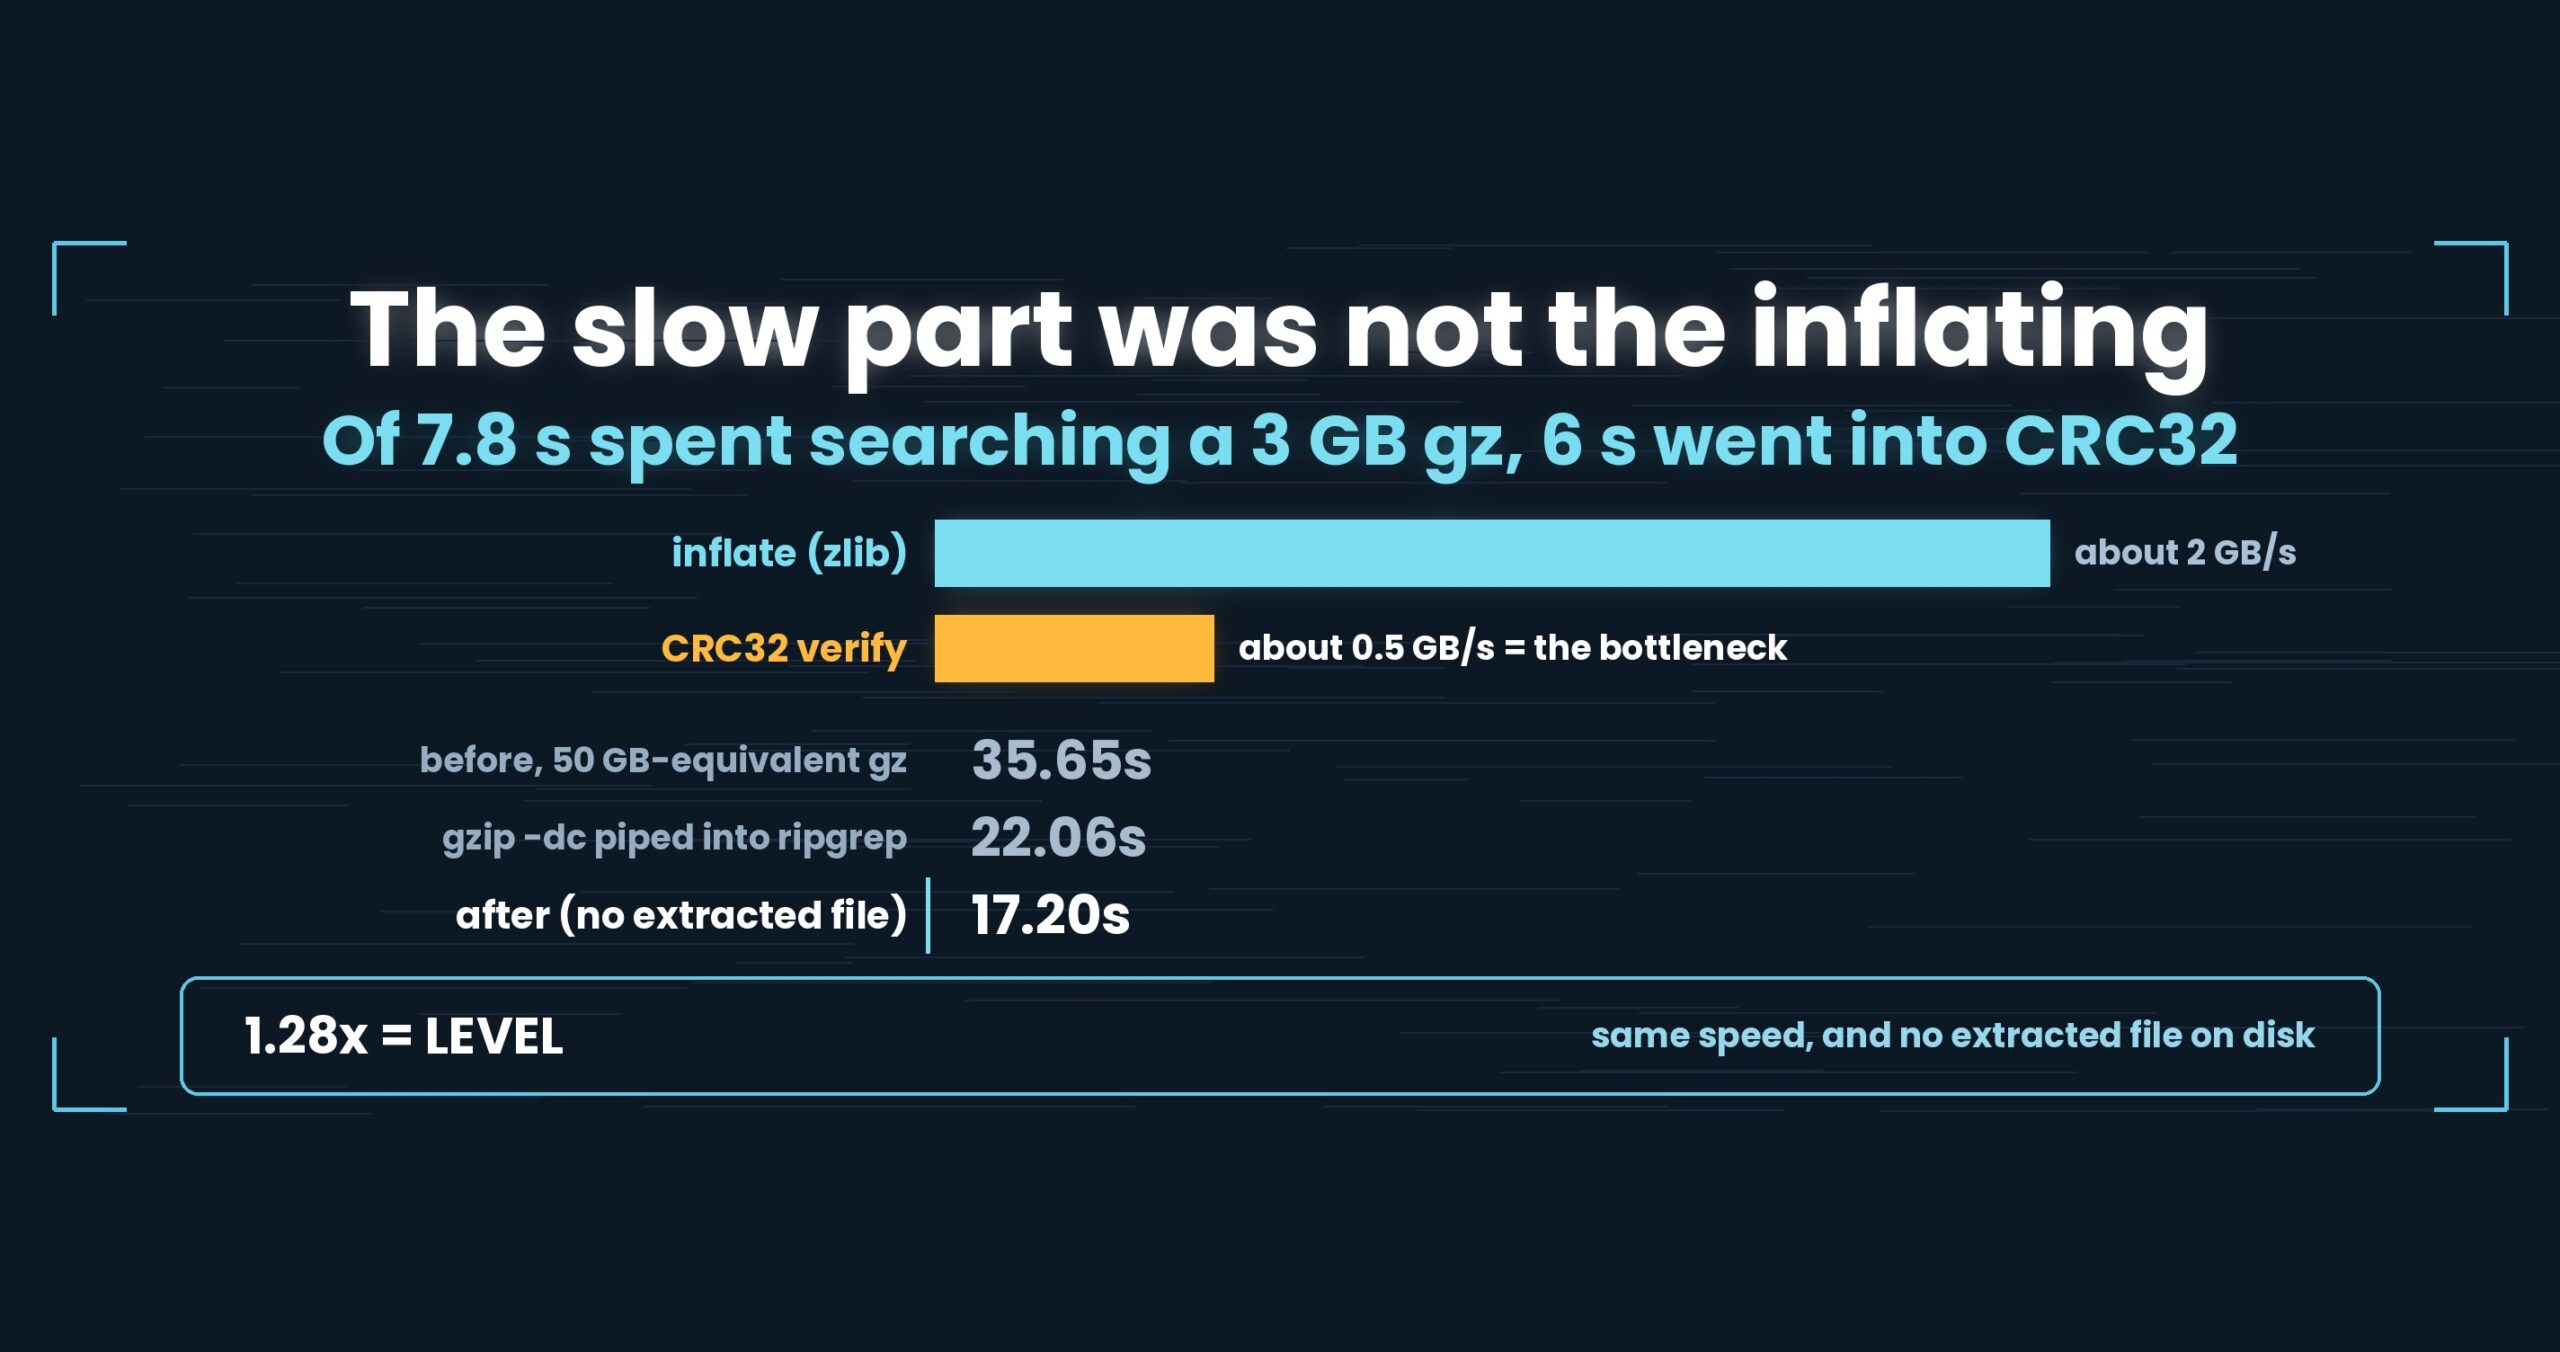
At 50 GB we were level with ripgrep. At 3 GB we were 1.48× slower. The smaller the file, the worse we looked — which is backwards, since we are the tool carrying an index.
So what was pointing the wrong way?
- Up front: the cost was a constant, not the search
- The problem: we got worse as the file got smaller
- Cause 1: the loop finished before the optimizer showed up
- Cause 2: we launched a process on every single run
- The fix: apply the same change to something it should not help
- The numbers: a loss at 3 GB became a narrow win
- The general lesson: apply the change to something it should not help
- The tools behind this
- Links
Up front: the cost was a constant, not the search
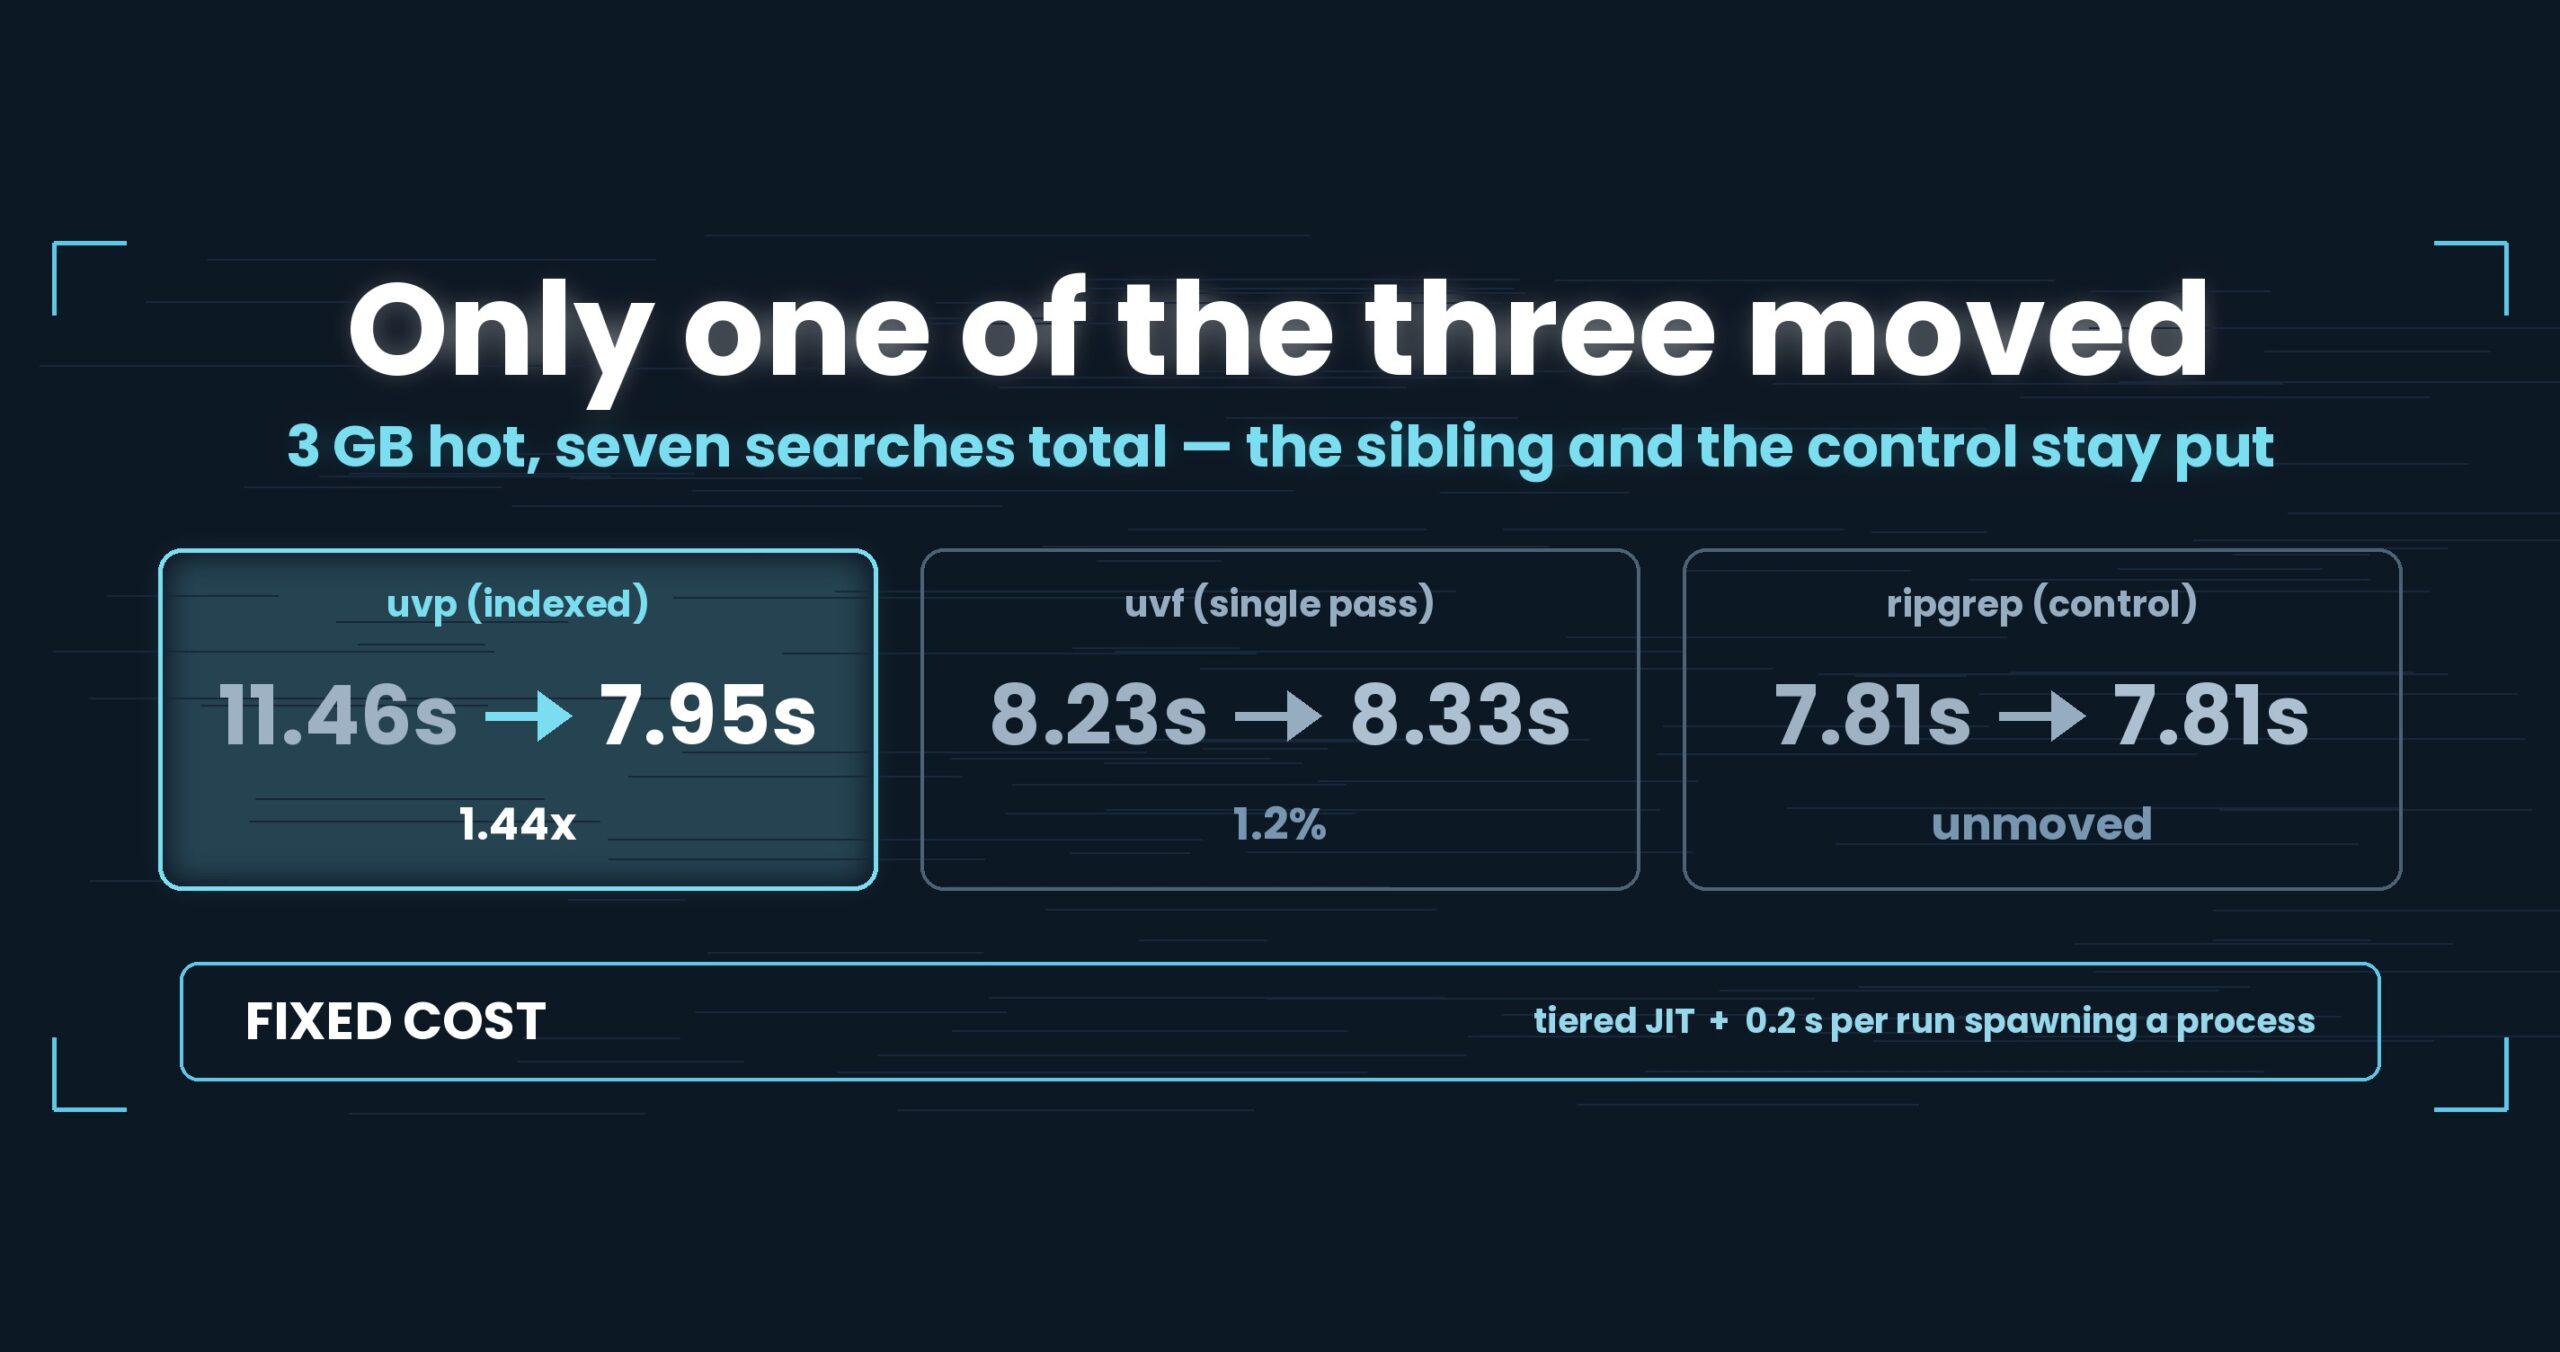
Losing at 3 GB had nothing to do with matching. It was overhead paid once per run, regardless of file size. Turning off .NET’s tiered JIT for loops (TieredCompilationQuickJitForLoops=false) and dropping an external ioreg process from the license check (~0.2 s per run) took seven hot searches at 3 GB from 11.46 s to 7.95 s (1.44×), and moved uvp‘s hot ratio against ripgrep from 1/1.48 to 1.16. The same setting applied to the free uvf build moves it by 1.2% — 8.33 s against 8.23 s — because that path is I/O bound. Mac M4, 32 GB RAM, external USB SSD, OpenStreetMap XML, second run (hot); one setup, results vary. Details at the end.
About this series. “First Light” is the pet name of UwView v1.6.6 — the release where both the GUI and the command line
started opening and searching a huge file in a single pass. This series follows what that took, one fix at a time.
Part 7 is the small end of the range: the fix that made short runs stop paying for the privilege of starting.
The problem: we got worse as the file got smaller
uvp, the paid command, keeps a .uwvz (compression plus index), so repeat queries are meant to be cheap. At 50 GB they are. At 3 GB, this is what we had:
3 GB, warm cache (hot), as of v1.6.3
uvp1.04 s- ripgrep 0.32 s
- ratio 1/1.48 — we were 1.48× slower
One second against a third of a second. Nobody’s workday is ruined by that. What bothered us was the direction. An index should make small files easier, not harder. Yet the ratio got worse as the work got smaller.
There is only one shape that produces this. Some term in the total time does not scale with the file. At 50 GB it is 0.4% of the run and invisible; at 3 GB it dominates. We were not hunting a slow algorithm. We were hunting a constant.
The question became: what does a single invocation pay for before it does any work, and how much is it?
Cause 1: the loop finished before the optimizer showed up
The first suspect was the runtime.
.NET compiles in tiers by default. Code starts in a quickly compiled, lightly optimized form, and once a method proves hot it gets replaced with an optimized version. For a server that runs for days this is exactly right: fast startup, and the long tail runs optimized code.
A short search never gets there. The loop that counts newlines and matches bytes across 3 GB runs to completion in the unoptimized tier. Long work benefits; short work pays. That is precisely the shape of the symptom.
The fix was one setting: TieredCompilationQuickJitForLoops=false — compile methods containing loops optimized from the start. Startup gets marginally heavier; short runs get their real speed.
Cause 2: we launched a process on every single run
The second one lived nowhere near the search code. It was in the license check.
To confirm the paid edition is entitled to run on this machine, we needed a stable machine identifier — and we were getting it by launching macOS’s ioreg as an external process.
Spawning a process is not cheap. Resolve the binary, fork, link, read the output, reap the child. About 0.2 s, every time.
That 0.2 s is identical whether the search takes 0.3 s or 300 s. It was the constant we had gone looking for.
Removing it was easy: the same value is available from an OS call. gethostuuid() on macOS, MachineGuid on Windows. No process, just a function. Because a changed identifier would invalidate existing users’ licenses, we have a test asserting the old and new paths return the same value.
The important part is that we had a 0.2 s estimate before we touched anything. If the measured improvement lands on that 0.2 s, the diagnosis was right. If it doesn’t, we fixed something else and got lucky.
The fix: apply the same change to something it should not help
This is the part of this release we would most like to keep as a habit.
We put the JIT setting into the free uvf build too. uvf has no .uwvz, no parallel search — it reads the file once, straight through. It should be I/O bound, which means making the CPU faster should change nothing. That is a prediction, made before the measurement.
Here is what came back.
3 GB, hot, seven searches, total
| default | with setting | change | |
|---|---|---|---|
uvp (paid, indexed) |
11.46 s | 7.95 s | 1.44× |
uvf (free, single pass) |
8.23 s | 8.33 s | 1.2% — nothing |
| ripgrep (control) | 7.81 s | 7.81 s | unmoved |
uvf did not move. That is not a failed experiment; it is a confirmation. We separately verified that the setting is actually present in the shipped runtime configuration, so it reached the binary and still did nothing — which is what “this path is bound by the disk, not the CPU” predicts.
And because ripgrep sat at 7.81 s twice, we know the bench itself was not drifting. Same machine, same session: one of three numbers moved by 1.44×, the other two did not. Had the SSD been in a mood, or the room warm, all three would have moved together.
One more symptom vanished from the same root. A separate report had uvp running 2–3× slower at 10 GB; the JIT setting cleared that too (cold 43.77 → 25.55 s, hot 29.12 → 11.20 s). Two distant symptoms disappearing on one setting is the strongest evidence we got that they shared a cause.
One more thing we moved: the in-flight text budget
Not overhead, but shipped in the same release. The cap on matched-line text held in memory during a scan was 256 MB; past that, output had to re-read every line back out of the .uwvz. On searches with enormous hit counts (11.53 million hits from a regex over 50 GB), 8 of the 15.0 s went into that re-read. Raising the cap to 512 MB pushes the condition further away.
The numbers: a loss at 3 GB became a narrow win
3 GB, hot, Mac M4, 32 GB RAM, external USB SSD, OpenStreetMap XML
| at v1.6.3 | v1.6.6 “First Light” | |
|---|---|---|
uvp vs. ripgrep (hot) |
1/1.48 (behind) | 1.16 (ahead) |
seven searches, total (uvp) |
11.46 s | 7.95 s |
-v (invert) alone |
3.59 s | 1.95 s |
uvf vs. ripgrep |
about even | about even (unchanged) |
How we are allowed to describe each of those:
- 1.44× on a seven-item total clears our threshold for totals (we do not call anything under 1.3× a difference across seven or more items), so it is a difference
- 1.84× on
-valone clears the single-item threshold (nothing under 1.5× counts), so it is a difference - 1.2% on
uvfclears nothing. It is “no effect” - 1/1.48 → 1.16 crosses from behind to ahead, but 1.16× is itself under 1.5×, so the honest word is “level”, not “faster”. The result of this part is not that we won; it is that a ratio pointing the wrong way stopped doing so
Being straight about it
- Every number above is warm cache (hot). Cold (after
sudo purge), reading dominates and this work is nearly invisible. Fixed-cost improvements only show up under conditions where fixed cost is visible - At 3 GB we are arguing about roughly one second. This release did not change how the tool feels at that size
- Counted as two runs together (first plus second),
uvpat 3 GB is 1.75×. The first run builds the.uwvz, so a two-run total flatters us less than a hot-only ratio flatters us. A ratio quoted without saying which counting it uses can be bent to taste - These are Mac measurements. Media and cache behavior differ elsewhere, so do not compare seconds across operating systems
- The measurement taken right after the fix recorded the ripgrep ratio as 1.17; the summary table settled on 1.16. 0.01 is inside run-to-run noise, not a contradiction
The general lesson: apply the change to something it should not help
The hard part of performance work is not making a number better. It is knowing whether it got better. Numbers move on their own, so one improved number proves nothing.
What helps is arranging things you predict will not move. We had three:
- the thing we fixed (
uvp) — should improve - a sibling with the same change but a different bottleneck (
uvf) — should not - an untouched third party (ripgrep) — should not
If only 1 moves, the change worked. If all three move, the environment moved. If 2 moves, our model of the bottleneck is wrong. Writing the predictions down first means any outcome teaches you something.
Second: varying the input size decomposes the total. Fixed costs are visible on small inputs, proportional costs on large ones. “Fast on huge files but losing on small ones” is usually not a performance bug at all — it is fixed cost becoming visible. The reverse, “only fast when small”, points at waste in the proportional part.
And the plainest lesson of the three. The single most effective line we changed was a line in a project file. The second was removing a subprocess from a license check. A speed problem does not have to live in the code that does the work. The rituals attached to every invocation — auth, config loading, version checks, spawning helpers — are usually worth counting first.
The tools behind this
UwView is a viewer for huge text and huge logs (free: UwView; paid: UwView Pro).
The same things, from the command line
# Ch.2: ask the same 3 GB file twice (the second one is the fast one)
uvp app.log 'ERROR'
uvp app.log 'timeout'

# Ch.4: invert — the item that went 3.59 s -> 1.95 s here
uvp app.log 'ERROR' -E 'health|ping'

# Ch.4: ignore case, regex
uvp app.log 'error' -i
uvp app.log -E 'timeout|refused'

# Ch.5: narrow with a second word (searched within the first word's hits)
uvp app.log 'ERROR' 'payment'

# Ch.5: results to a file
uvp app.log 'FATAL' -out fatal.txt
Exit codes match grep: 0 = found, 1 = not found, 2 = error or incomplete result, so if uvp app.log 'FATAL'; then works as written.
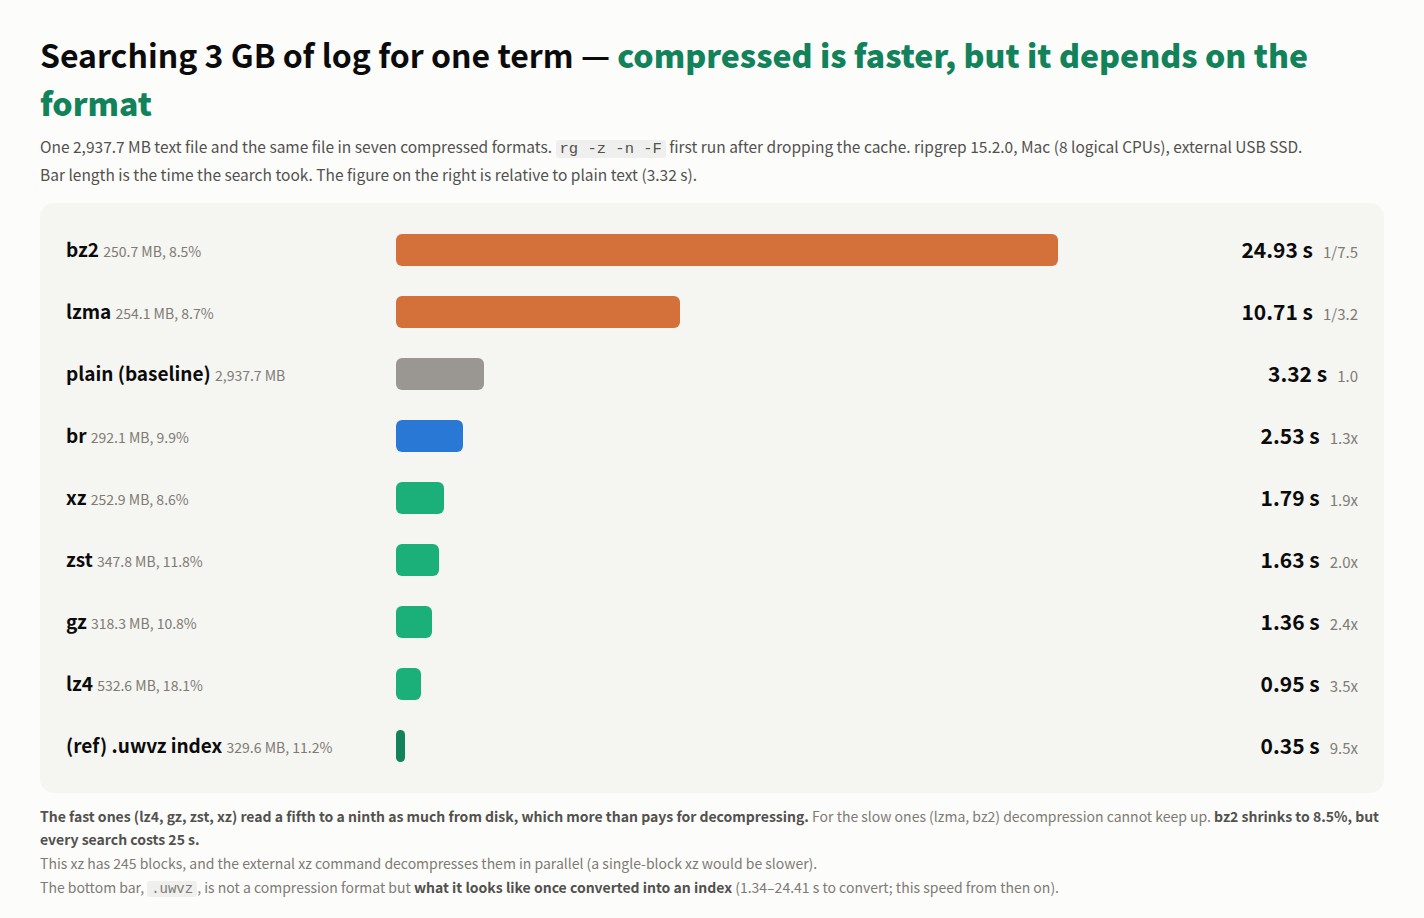
Honestly: the first query with uvp is a little slower than ripgrep, because it builds the .uwvz (compression + index) first — at 50 GB, 59.0 s vs. 54.9–55.8 s = 6–7% (v1.6.6.1). It pays off from the second query on: the same 50 GB search returns in 6.56 s, about 8.4× ripgrep. On small files like 3 GB it is about even — the index buys you less. The free uvf is on par with ripgrep at any size (measured article; Mac M4, 32 GB RAM, external USB SSD, OpenStreetMap XML — one setup, results vary).
Links
- Part 1 — the day we wrote “this is not a speed tool”: https://uvp.y42u.net/en/blog/uwview-fl01-v160-confession-en/
- Part 2 — folding two and a half passes into one: https://uvp.y42u.net/en/blog/uwview-fl02-one-pass-rawgrep-en/
- Part 5 — three different counts from one command: https://uvp.y42u.net/en/blog/uwview-fl05-deterministic-count-en/
- Where we first caught up with ripgrep at 3 GB: https://uvp.y42u.net/en/blog/uvp-beat-rg-at-3gb-en/
- 81 checks against ripgrep and sed, line by line: https://uvp.y42u.net/en/blog/uvp-vs-ripgrep-sed-81-checks-en/
- Source (GitHub): https://github.com/amru195704/UwView
And if huge logs are eating your storage and you want them kept compressed and still searchable, try UwView Pro: a persistent index, search inside the compressed cache, and about 1/9 the storage, with reopening and searching both a step faster (all OSes; one-time purchase or subscription).
From the developer: a list of my apps, Kindle books, and open source is at GitHub: amru195704.