Nothing reads 10 GB in 2.65 seconds.
That was the number recorded for a “cold” read of a 10 GB file on Windows. No drive in that machine, internal or external, delivers 3.8 GB/s.
The number was too fast. Which means we were measuring something other than what we thought.
- Up front: three operating systems, one harness, and the lesson was about procedure
- The problem: numbers from one OS are a statement about one OS
- The harness: one cold run and one hot run per item
- Trap 1: “cold” on Windows does not exist without administrator rights
- Trap 2: “hot” is not a single state
- The numbers, each within its own OS
- Decide how to treat outliers before you have any
- Being straight about this
- What generalises
- The tools
- Links
Up front: three operating systems, one harness, and the lesson was about procedure
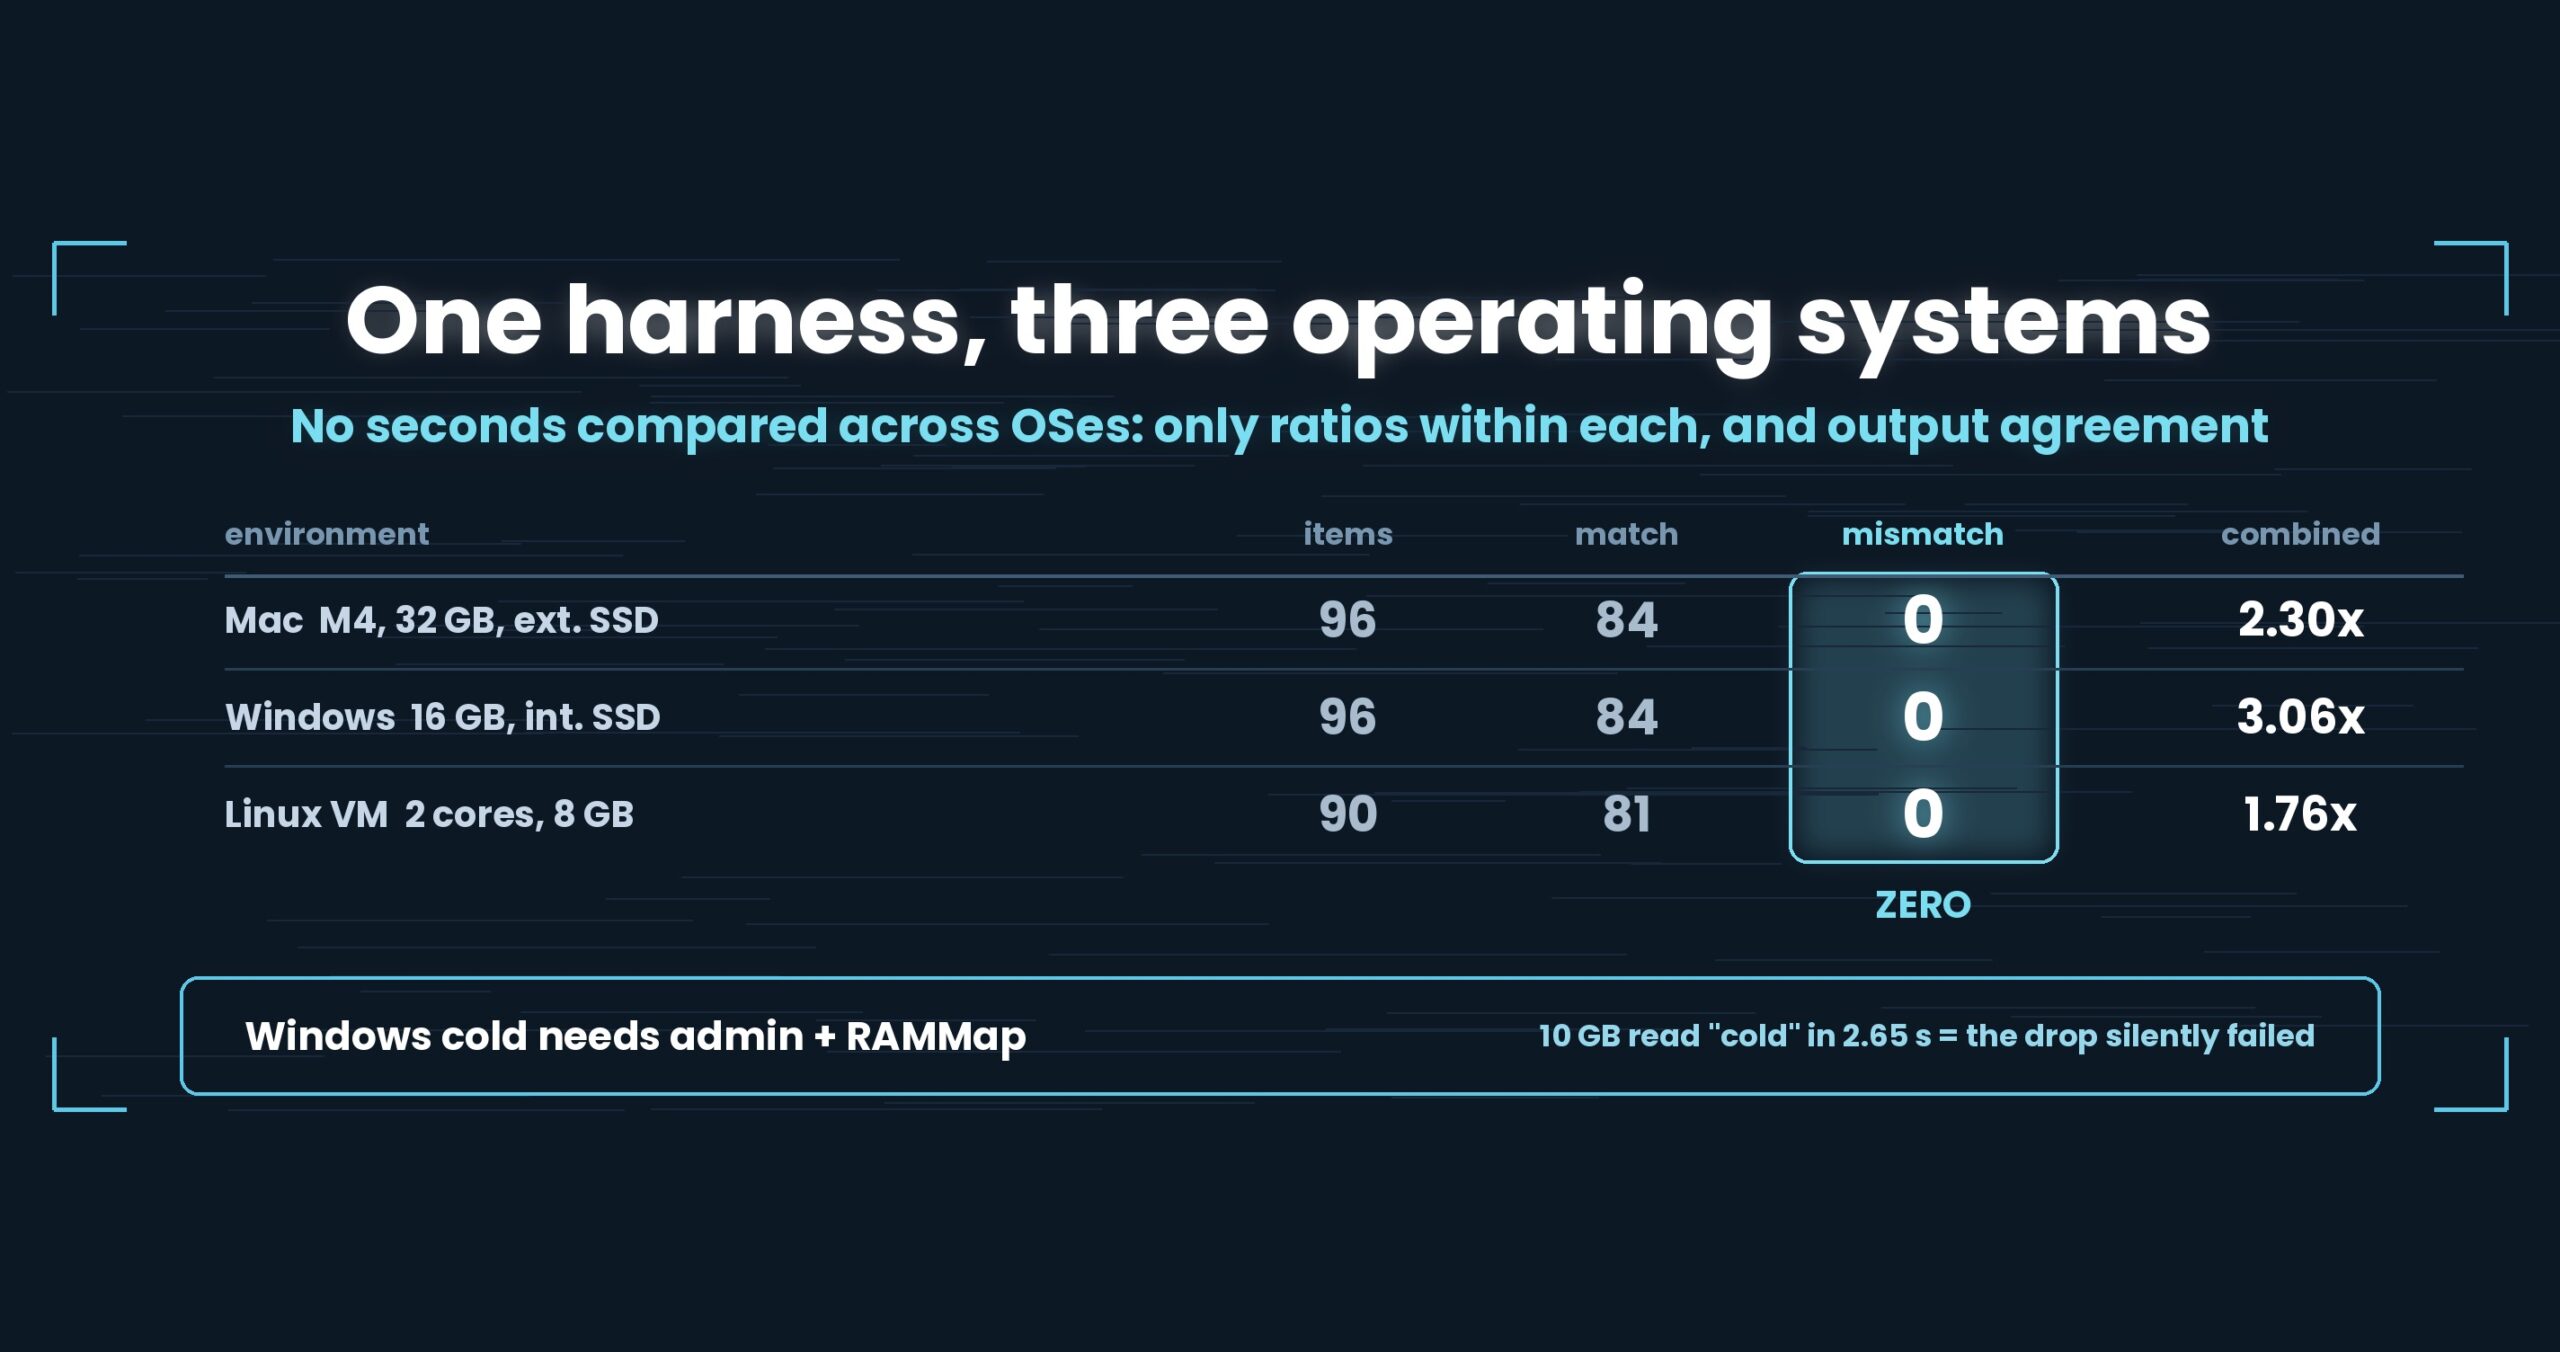
We ran the same measurement harness on Mac, Windows and a Linux VM. Comparable items: 96 on Mac, 96 on Windows, 90 on Linux (no gz inputs there). Output mismatches against ripgrep and sed: zero on all three. Combined ratios across every item (cold + hot) came to 2.30x on Mac, 3.06x on Windows, 1.76x on the Linux VM — but those three are not one leaderboard, since the machines and the media differ. We never compare seconds across operating systems, only ratios within each. And the biggest finding was not a speed at all: on Windows, cache dropping silently fails without administrator rights and RAMMap, which invalidates every “cold” figure in the run. We threw one full run away and re-measured. v1.6.6 “First Light”; ripgrep 15.2.0 (15.1.0 on Linux). Details at the end.
About this series. “First Light” is the pet name of UwView v1.6.6 — the release where both the GUI and the command line
started opening and searching a huge file in a single pass. This series follows what that took, one fix at a time.
The problem: numbers from one OS are a statement about one OS
Almost every second published in this series so far came from the same Mac. Sometimes that is enough. Sometimes it is not.
- ripgrep’s strengths shift between operating systems
- Decompressing the
.uwvz(UwView Pro’s compression format plus index) costs CPU, so a machine with few cores is at a disadvantage - Every OS drops its page cache differently, and some of them fail to drop it without saying so
We added environments not to collect wins, but to find out which of our conclusions only held on a Mac.
The harness: one cold run and one hot run per item
Each item runs in this order:
sync- drop the cache (
sudo purgeon Mac, RAMMap on Windows,drop_cacheson Linux) - wait 10 seconds
- cold (first run)
- hot (second run, cache warm)
“Combined” means cold + hot. Comparing a tool that builds an index on the first query against a tool that re-reads every time is least misleading when both runs are recorded separately and also summed. Show only one of them and either side can be made to look good.
And output equality is checked before speed. Same input to ripgrep or sed -n p; do the emitted lines match exactly? Timings from a tool that disagrees are worthless.
Trap 1: “cold” on Windows does not exist without administrator rights
Back to those 2.65 seconds.
Windows has no built-in equivalent of purge or drop_caches. Dropping the file cache needs something like RAMMap, and it needs administrator rights.
What happens without them is the dangerous part: nothing errors out. The drop quietly fails, and the “cold” run that follows is just another warm run. The seconds look plausible. Nothing in the table gives it away.
We caught it because the number was physically impossible. 10 GB in 2.65 s is 3.8 GB/s, which that machine’s storage cannot do. It is a textbook case of the Part 9 rule: a figure above the raw-read ceiling is evidence of a measurement fault, not of speed.
In the replacement run the cache drop fired 171 times as expected. Cold and combined figures come only from that run; the earlier one was discarded whole. Patching in a few rows would have left one table holding two different conditions.
A side effect: one outlier disappeared
The discarded run contained a uvf hot figure of 45.94 s at 10 GB. The re-run gave 29.25 s — essentially the 29.22 s of the previous release.
A value that does not reproduce gets deleted, not footnoted. We put it down to a transient (resident antivirus, or thermals) and withdrew the half-written explanation about “Windows being mysteriously slow at 10 GB” along with it.
Trap 2: “hot” is not a single state
Crossing operating systems exposed something else: the word “hot” meant a different state on each machine.
Second run of ripgrep against the 10 GB file:
| Environment | RAM | ripgrep, 10 GB, hot |
|---|---|---|
| Mac | 32 GB | 11.08 s (not cached) |
| Windows | 16 GB | about 4.7 s (cached) |
| Linux VM | 8 GB | 17.18 s (not cached) |
Windows has less memory and yet held the file. Free memory is not a function of total memory; it depends on what else is resident at that moment.
So “hot” is a continuum — how much of the file is still resident. Comparing 10 GB hot ratios across environments without pinning that down means publishing cache luck as a performance difference. We decided not to compare the 10 GB hot ratios across environments at all.
The numbers, each within its own OS
All comparable items, combined (cold + hot)
| Environment | Items | Combined ratio (them ÷ us) |
|---|---|---|
| Mac (M4, 10 cores, 32 GB, external USB SSD) | 96 | 2.30x |
| Windows (laptop, 16 GB, internal SSD) | 96 | 3.06x |
| Linux VM (VMware, 2 cores, 8 GB) | 90 | 1.76x |
All three clear the “1.3x on a total of seven or more items” bar from Part 9, so they count as differences. But reading 2.30 / 3.06 / 1.76 as a ranking is only half right. The Windows ratio is large partly because ripgrep is slow on that machine. A ratio is set by both sides, not one.
Seven search variants, combined, uvp against ripgrep
| Environment | 3 GB | 10 GB | 50 GB |
|---|---|---|---|
| Mac | 1.75x | 2.79x | 3.08x |
| Windows | 1.97x | 2.51x | 2.85x |
| Linux VM (2 cores) | 1/1.01 (even) | 1.99x | 1.86x |
Only the Linux VM at 3 GB comes out even. At 1/1.01 it is neither a win nor a loss.
The cause is clear: on a two-core VM, decompressing the .uwvz becomes CPU-bound. Carrying an index buys you fewer bytes to read at the price of more CPU. With two cores that trade does not close, and plain sequential reading wins.
Part 7 explained 3 GB weakness as fixed cost. On the Linux VM the cause is core count instead. The same symptom, a different reason, once the environment changes.
Output agreement
| Environment | Matching | Mismatching |
|---|---|---|
| Mac | 84 items | 0 |
| Windows | 84 items | 0 |
| Linux VM | 81 items | 0 |
This is the table that matters most. Timing tables move with conditions; a tool that emits different lines is unusable regardless of conditions. Zero disagreements across three operating systems belongs above every row of seconds.
Decide how to treat outliers before you have any
One Mac 3 GB row showed a cold time of 10.69 s on the comparison side. The same work expressed a different way measured 4.87 s. More than a factor of two apart.
Three options: take the faster one (bad for us), take the slower one (good for us), or print both.
The rule we settled on: when the same work is measured two ways, use the row where the other tool looks faster — the one that disadvantages us. The point is not modesty. It is having a rule for outliers that does not consult our own interests, fixed before the data arrives. The previous release was tabulated the same way, so version-to-version comparisons stay intact.
Being straight about this
- The three environments are not one arena. Mac on an external USB SSD, Windows on an internal SSD, Linux in a virtual machine. We do not compare seconds across them — only ratios inside each
- Linux is one VM with 2 cores and 8 GB. Real Linux hardware may behave differently; the low core count is precisely what produces the 3 GB tie
- Windows caches the 10 GB file on the hot run. Do not compare 10 GB hot ratios between environments
- ripgrep is 15.2.0 on Mac and Windows but 15.1.0 on Linux — not perfectly matched
- With
sudounavailable in some cases, part of the measurement ran withoutpurge. At 1.6x the 32 GB of RAM, a 50 GB sequential read cannot stay cached, so we treat it as effectively cold — but it is not strictly cold - Linux has no gz inputs, which is why it shows 90 items instead of 96. The three environments were not compared over an identical item set
- “Combined” is cold + hot. Looking at the first run alone paints a different picture (worse for the side that builds an index)
- I develop one of the two tools being compared. Discount accordingly
What generalises
(1) Do not accept a number that is too fast. The dangerous figure here was not a slow one; it was a fast one, which reads as a good result in a table. We caught it only because we already knew the raw-read ceiling. Measuring the ceiling is also how you audit your own numbers.
(2) Cache-dropping fails silently, differently per OS. Because nothing errors, the drop itself needs verifying by other means: count the drops, check the cold/hot gap is the size you expect. The procedure needs its own checks.
(3) The point of adding environments is not more wins. It is that explanations which only held in one place fall apart. Here, “3 GB is weak because of fixed cost” became “because of core count” on Linux. Add environments to find where your explanation breaks.
(4) Put output equality ahead of timing. Speed tables move with conditions; a tool that returns the wrong answer is unusable under all of them. Reading the agreement table first protects your own implementation too.
The tools
UwView is a viewer for huge text and log files (free UwView / paid UwView Pro).
Doing the same thing from the command line
# The shape of one item: drop the cache, run once, then run again
sync && sudo purge && sleep 10
/usr/bin/time -p uvp huge.log 'ERROR' > /dev/null   # cold (first query, builds the index)
/usr/bin/time -p uvp huge.log 'ERROR' > /dev/null   # hot (second query)

# Check you emit the same lines before you compare any timing
uvp huge.log 'ERROR' -out mine.txt
rg 'ERROR' huge.log > theirs.txt

# Lines only, to line up against sed -n p
uvp huge.log 'ERROR' -grep

# Exit code when there is no match
uvp huge.log 'ZZZ-not-found'; echo $?
Exit codes match grep: 0 = found, 1 = not found, 2 = error or incomplete result. We discard timings from runs that exited 2 — a truncated run is not comparable with a complete one.
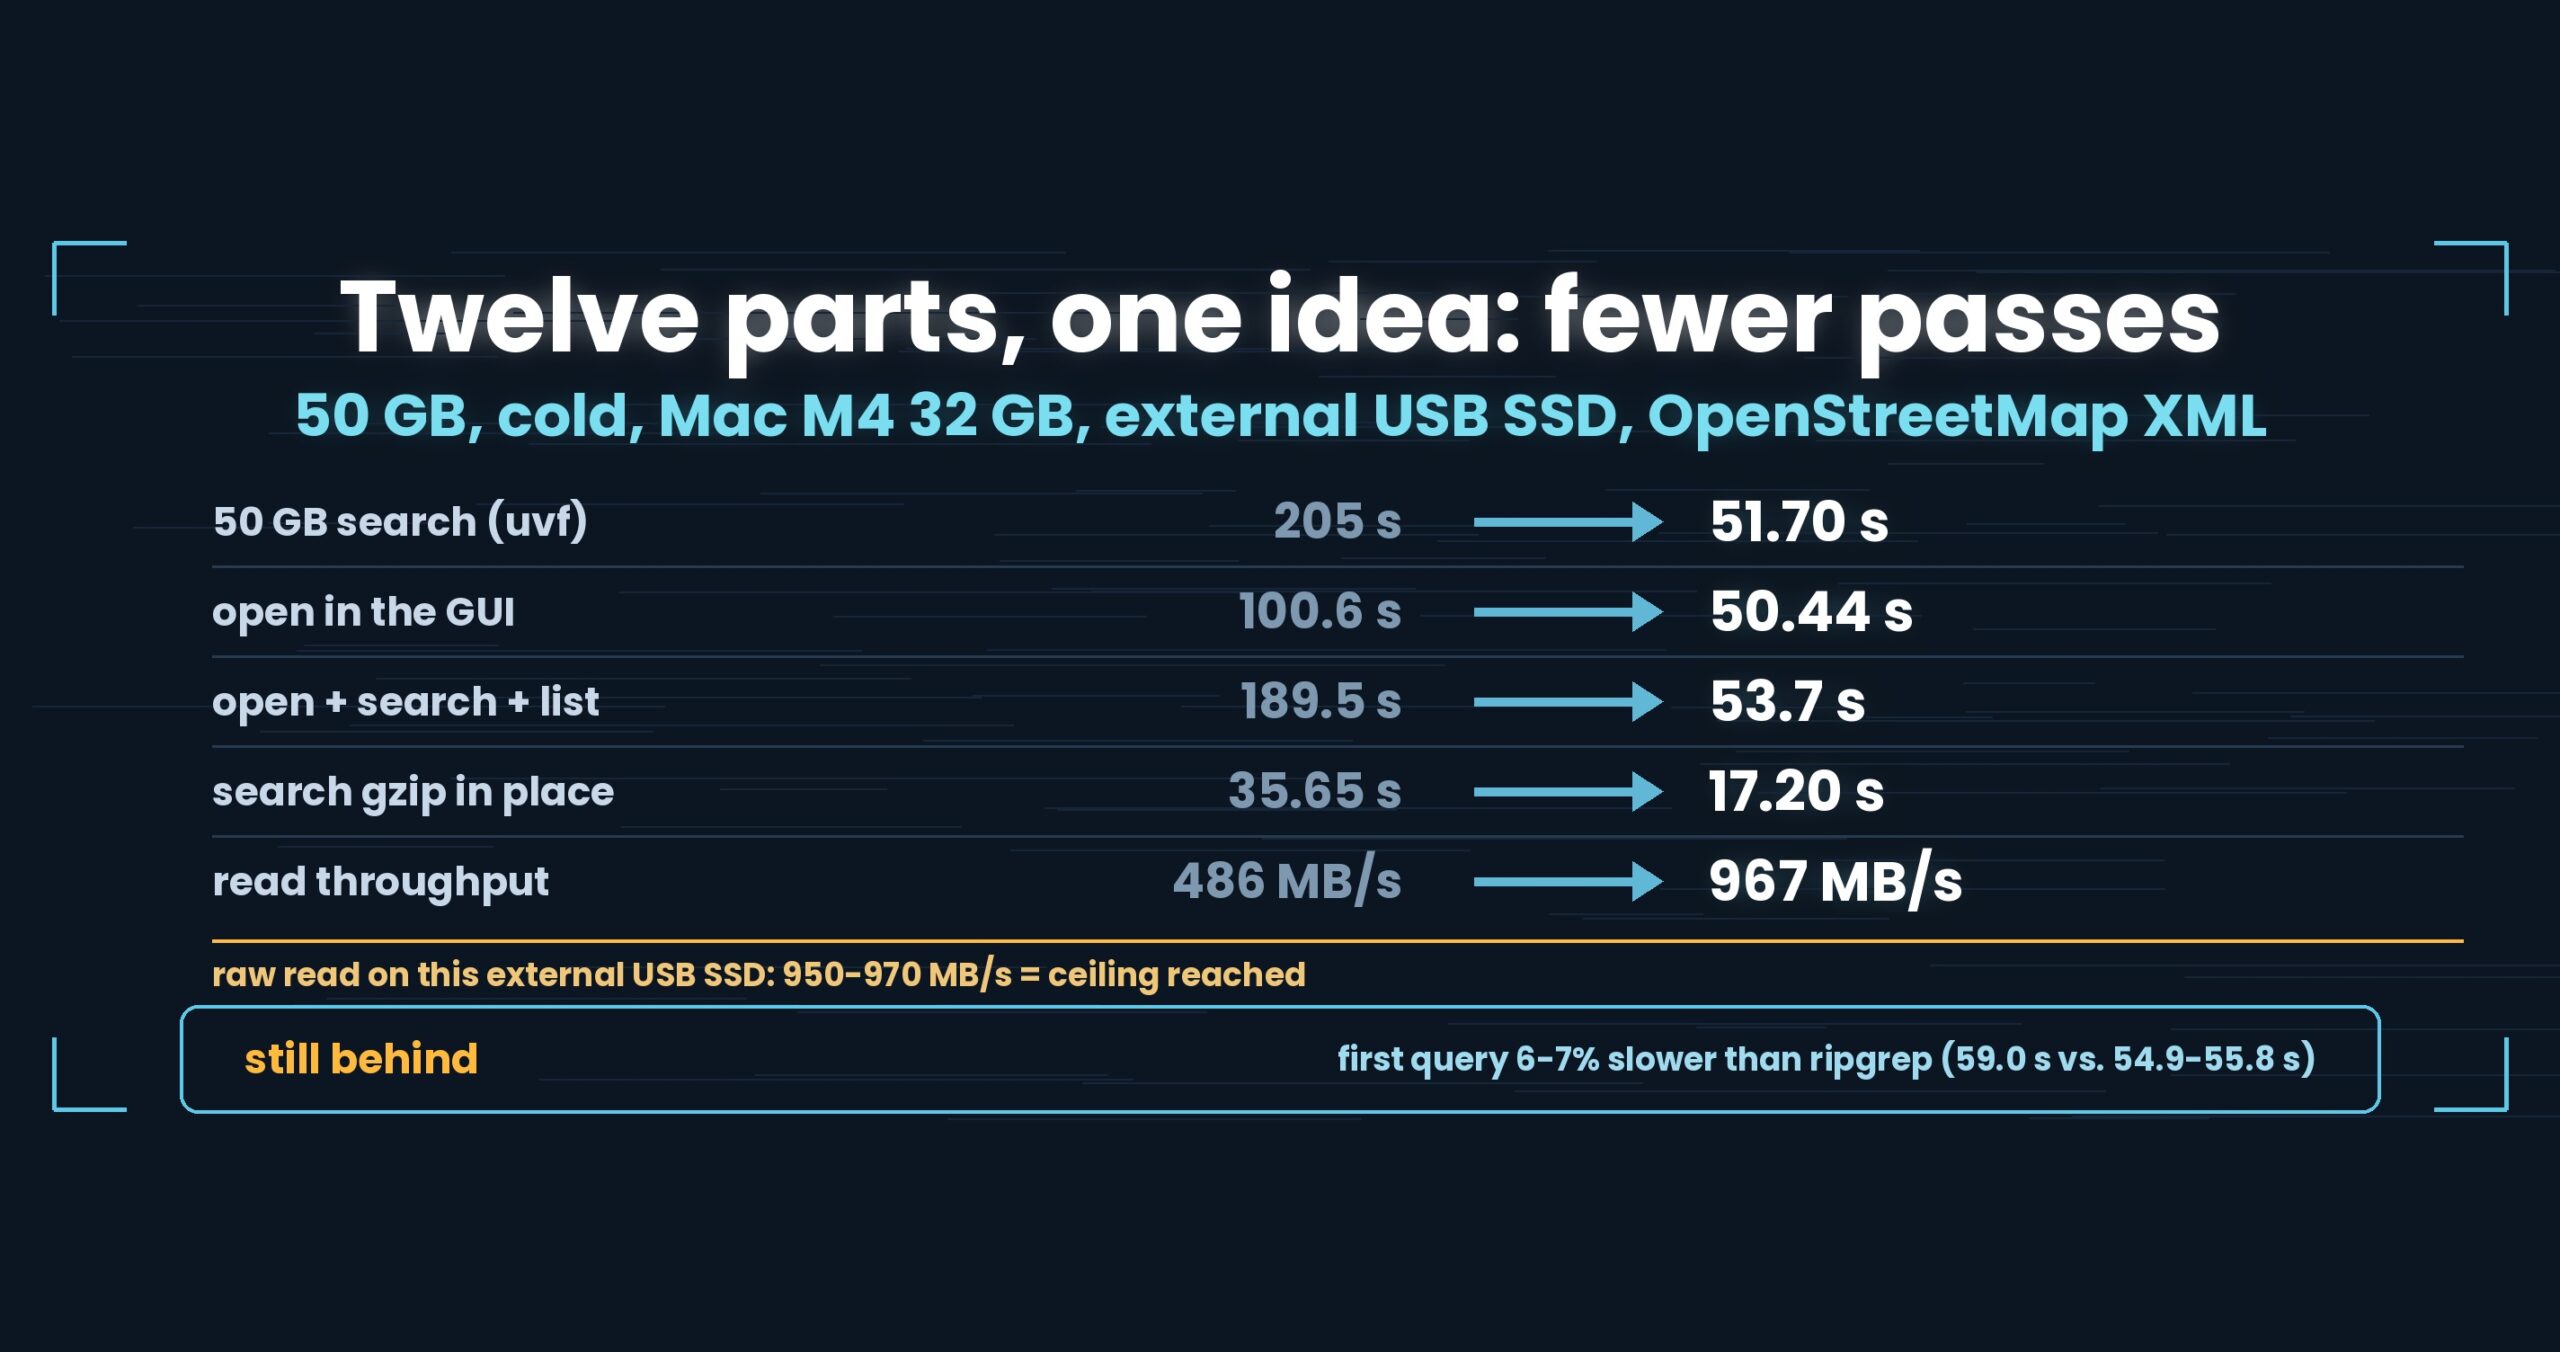
Honestly: the first query with uvp is a little slower than ripgrep, because it builds the .uwvz first — at 50 GB, 59.0 s vs. 54.9–55.8 s = 6–7% (v1.6.6.1). It pays off from the second query on: the same 50 GB search returns in 6.56 s, about 8.4x ripgrep. On small files like 3 GB it is about even. The free uvf is on par with ripgrep at any size (measured article; Mac (Apple M4, 10 cores), 32 GB RAM, external USB SSD, OpenStreetMap XML — one setup, results vary).
Links
- Part 5 — three different counts from one command: https://uvp.y42u.net/en/blog/uwview-fl05-deterministic-count-en/
- Part 7 — the 3 GB file lost to startup cost, not I/O: https://uvp.y42u.net/en/blog/uwview-fl07-3gb-fixed-cost-en/
- Part 8 — searching a gzip without extracting it: https://uvp.y42u.net/en/blog/uwview-fl08-gz-without-extract-en/
- Part 9 — where a difference begins: https://uvp.y42u.net/en/blog/uwview-fl09-difference-threshold-en/
- 81 checks against ripgrep and sed, line by line: https://uvp.y42u.net/en/blog/uvp-vs-ripgrep-sed-81-checks-en/
- Source (GitHub): https://github.com/amru195704/UwView
And if huge logs are eating your storage and you want them kept compressed and still searchable, try UwView Pro: a persistent index, search inside the compressed cache, and about 1/9 the storage, with reopening and searching both a step faster (all OSes; one-time purchase or subscription).
From the developer: a list of my apps, Kindle books, and open source is at GitHub: amru195704.