The encryption took eleven minutes.
What matters is the six days before it. Which log do you read first, and in what order?
The trace is never in one line. It’s in the arrangement.
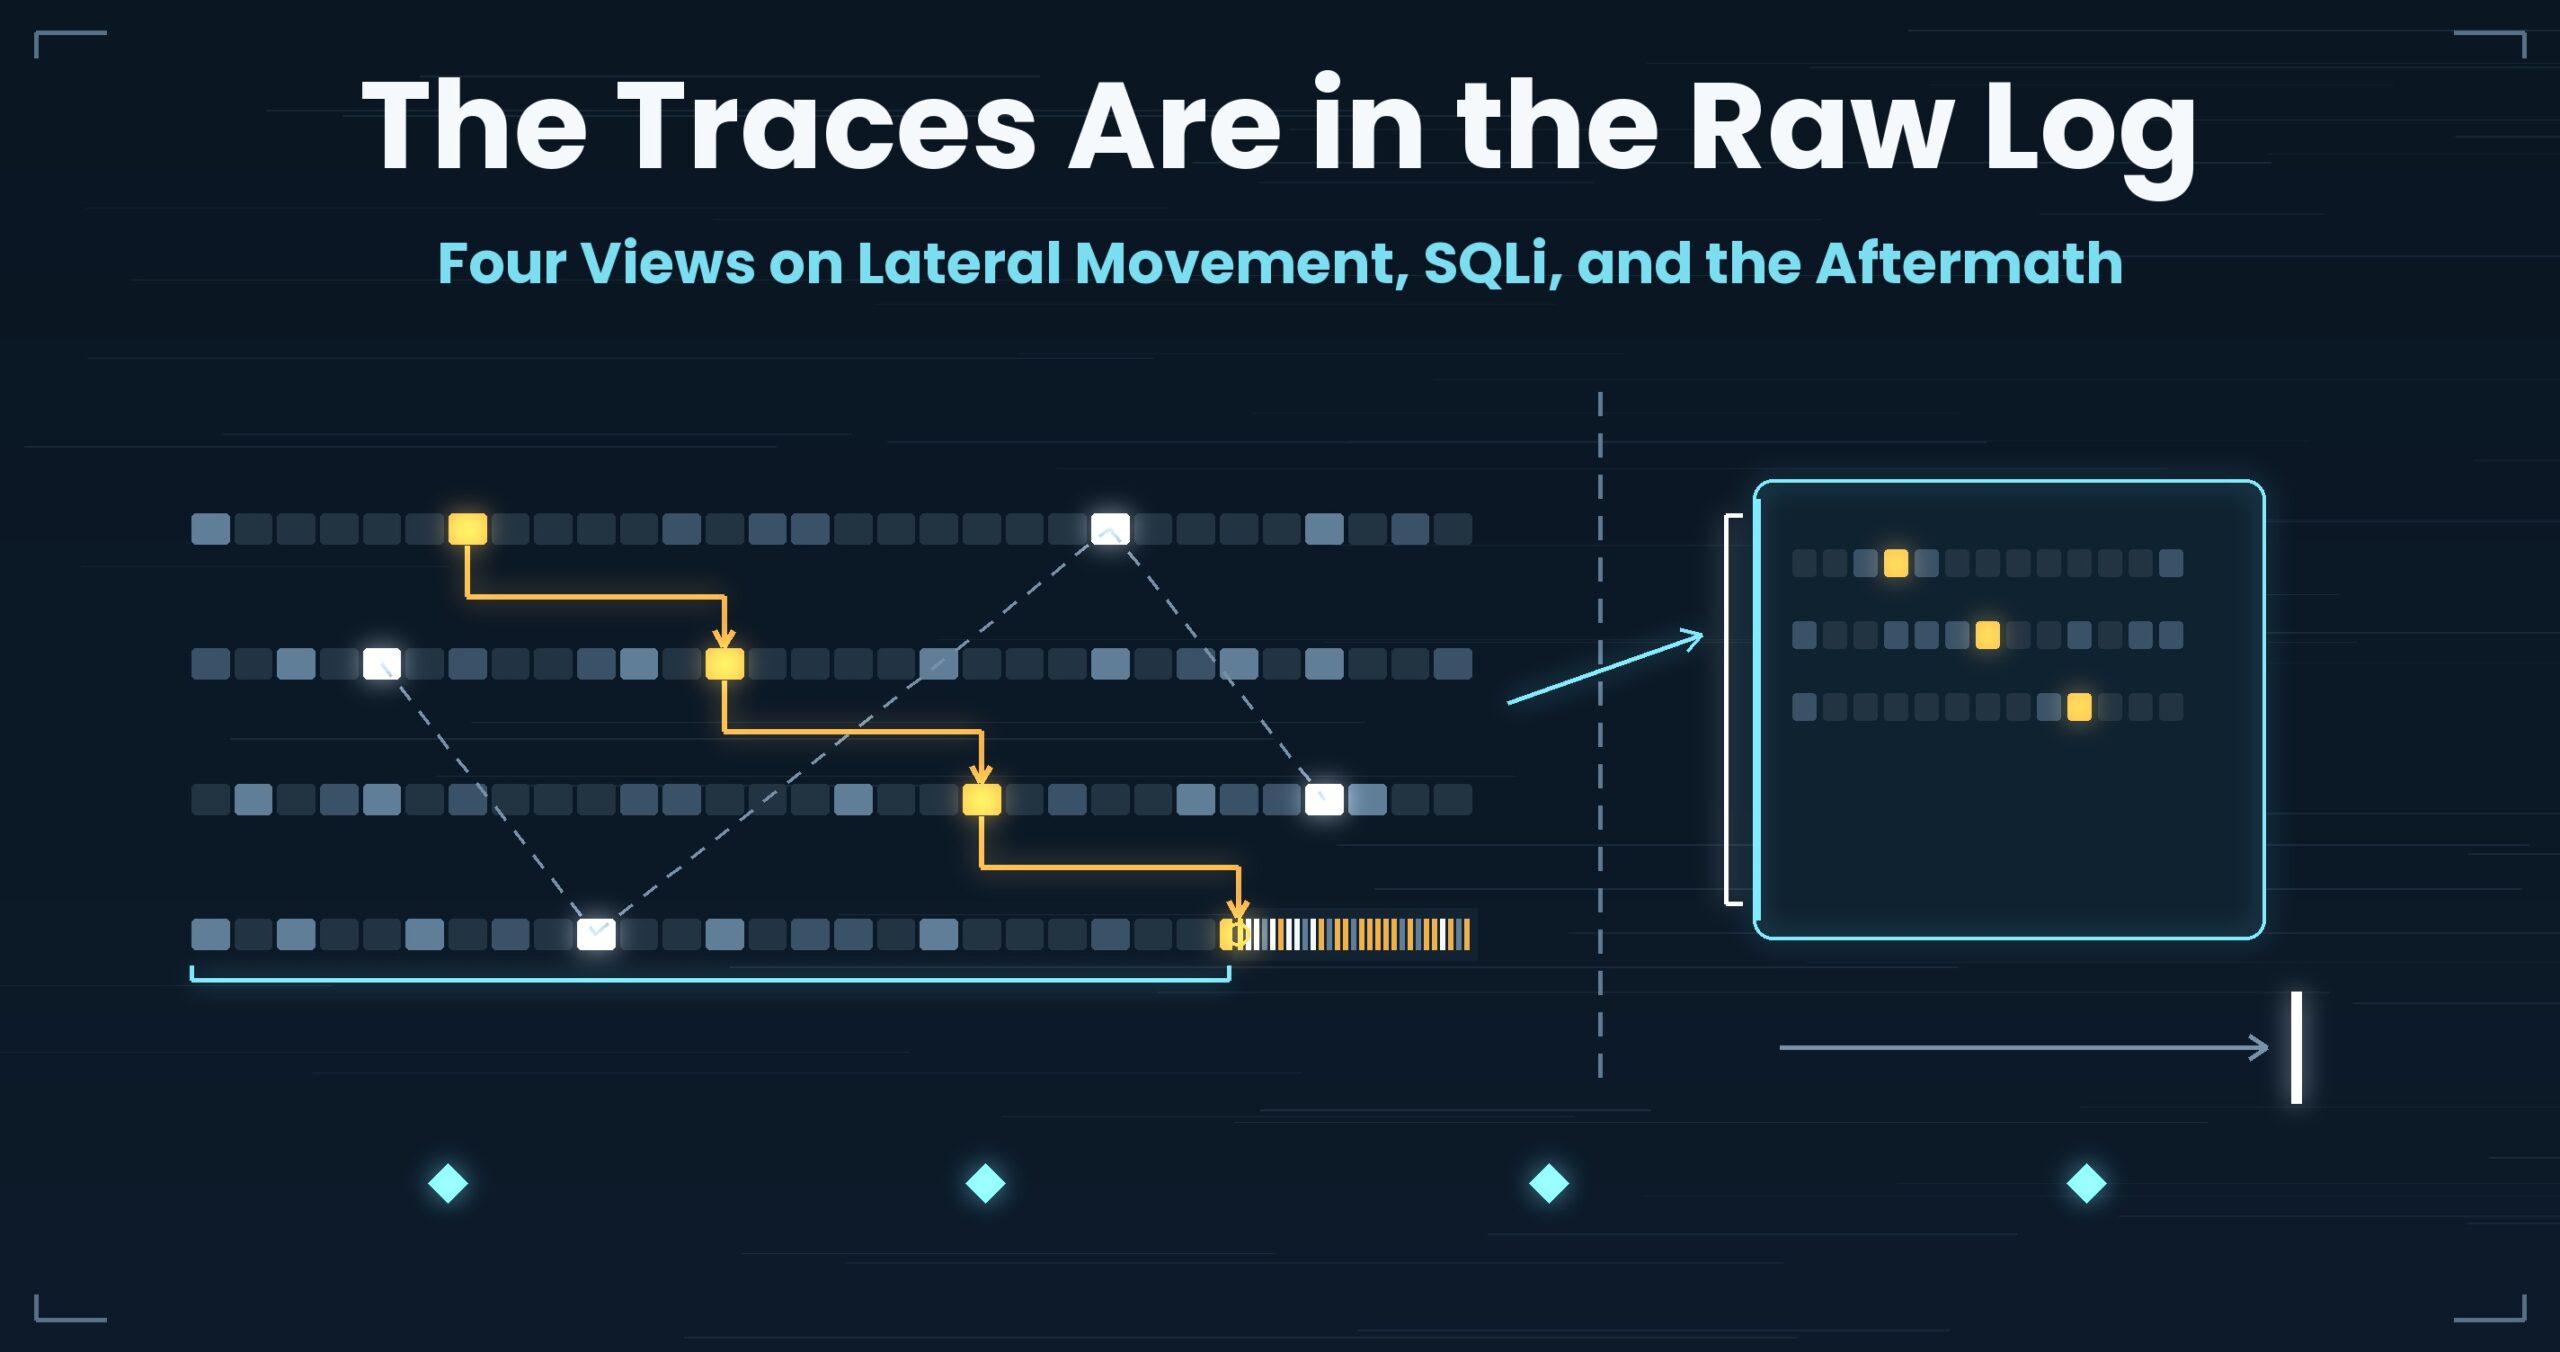
Part 6 covered what to look at in the hours right after a suspicion is raised. This one is about what comes after: showing, in a defensible way, what already happened. Tracing lateral movement, investigating a ransomware event after the fact, finding the SQLi that got past the WAF, and inventorying personal data. Different goals, different people — and all four operating under the same constraints: don’t touch the original, don’t let the data leave, and be able to cite your evidence.
- Up front: UwView Pro’s sequence search matches only where w1 → w2 → w3 appear in that order, so an attack pattern like auth success → privilege escalation → connection to another host becomes the query itself. Drill-down search stacks the narrowing and shows the count at each stage, so you can change a condition and see what it did. Everything runs on your own machine — the file is never sent anywhere (measurements are from one setup and vary; details at the end)
- 1. Lateral movement — the identifier changes hands mid-trail
- 2. Ransomware, after the fact — the interesting part is just before
- 3. The SQLi that got past — what a WAF log doesn’t hold
- 4. Inventorying personal data — one person is not one key
- What all four had in common
- The tool I use
- Links
Up front: UwView Pro’s sequence search matches only where w1 → w2 → w3 appear in that order, so an attack pattern like auth success → privilege escalation → connection to another host becomes the query itself. Drill-down search stacks the narrowing and shows the count at each stage, so you can change a condition and see what it did. Everything runs on your own machine — the file is never sent anywhere (measurements are from one setup and vary; details at the end)
This article assumes you already have preserved logs in hand and are deciding how to read them. Containment, preservation, notification, and reporting procedures themselves belong to your organisation’s policy and the relevant authorities.
1. Lateral movement — the identifier changes hands mid-trail
Situation
You know patient zero. The question from above is always the same: “How far did it spread?”
On disk you have the VPN gateway log, the authentication server log, the jump host’s sshd log, and the file server’s audit log. Four products, four formats. One attacker’s behaviour, split across four files.
Why it happens
Lateral movement isn’t an anomaly inside one machine. It exists only in the space between logs.
Worse, the identifier you’re chasing changes hands. A VPN session ID gets you in; an authentication ticket is issued behind it; that ticket opens an SMB session to a share. Three different strings, and there is no column that joins them. What joins them is a fact: at the same moment, from the same source, the next identifier came up.
So the test isn’t a term — it’s an order. VPN success → ticket issued → connection to another host → share enumeration. In that order, it’s lateral movement. Out of order — share enumeration before the ticket was issued — it’s someone doing their job. The clock skew between servers that part 7 covered can flip that conclusion outright.
What general tools do, and where they stop
You collect across files, then order by time.
grep -h -F 'S-1a9f3c' vpn.log auth.log sshd.log fileserver.log   # the ID you know
# merge the window across files into one timeline (field positions vary)
sort -m -k1,2 <(grep '2026-08-2[0-6]' vpn.log) <(grep '2026-08-2[0-6]' auth.log) | less
# harvest identifiers that came up inside that window
awk '$1 >= "2026-08-24T02:10" && $1 <= "2026-08-24T02:40"' auth.log | grep -o 'TGT=[A-Za-z0-9]*' | sort -u
The third command is the real work. Search the known ID → read the window → harvest a new ID → search that. One round trip per hop in the chain.
Three limits. First, every round trip re-reads the originals from the top. Five hops means five passes, and the hypotheses that don’t pan out add more. At tens of seconds each that’s tolerable in isolation; an after-the-fact scope determination isn’t finished until the chain is exhausted.
Second, you can’t watch four files at once. sort -m gives you something readable, but the moment you merge, you lose which line came from which file. What you actually wanted was four files open, moving through the same window in all of them.
Third, grep cannot express order. grep -E 'VPN|TGT|SMB' returns lines containing any of the three; it never looks at the arrangement. You can write a state machine in awk, but on a trail where the identifier keeps changing, that means a throwaway script for every hunch — which is not the pace this work runs at.
2. Ransomware, after the fact — the interesting part is just before
Situation
The encryption is done. Restore is running from backup. In parallel, a second assignment lands: “When did they get in? What did they take?”
Production is isolated. What you have is a preserved copy of the file access and audit logs. Tens of gigabytes, most of it still .gz.
Why it happens
The encryption phase is short, and the records that matter are in the quiet days before it.
Encryption produces an enormous volume of writes, so on a timeline it’s a dense black band. Only a small slice of the incident is blacked out. What you want to read is before that — the exploration, the bulk reads, the archive being assembled, the outbound transfer. That part looks almost exactly like a normal week.
And after-the-fact work carries two constraints that outage triage doesn’t. One is preservation: no operation that writes to or rewrites the original. The other is where the data may live. Uploading logs from a compromised system to an external analysis service is often off the table for contractual or policy reasons. Running entirely on the local machine is frequently a requirement, not a preference.
What general tools do, and where they stop
Search without unpacking to disk.
zgrep -h 'READ\|COPY' audit-2026-08-*.log.gz | head -100
# narrow to the 24 hours before encryption began
zcat audit-2026-08-24.log.gz | awk '$1 >= "2026-08-24T00:00" && $1 <= "2026-08-25T03:12"' | less
zcat audit-*.gz | awk '{print $5}' | sort | uniq -c | sort -rn | head -20   # who touched the most
zgrep is the right instinct: nothing is written to disk, which is also the correct posture for preservation.
Three limits. First, every change of mind decompresses again. zgrep runs the decompression per search, and after-the-fact investigation is nothing but changing your mind. The cost multiplies by the number of hypotheses (part 8 went into this trade in detail).
Second, you can’t size “just before” in advance. Whether 24 hours is enough or you need six days is something you learn by looking. awk‘s range wants the answer before you open, and every revision is another full pass.
Third, the test is, again, an order. bulk read → archive created → outbound connection in that sequence is exfiltration. The same three terms in a scrambled order are usually a backup job.
3. The SQLi that got past — what a WAF log doesn’t hold
Situation
You have a WAF, so you have a record of what it blocked. What you actually need to examine is the requests it didn’t block — and those exist only in the raw access log of the web server.
Why it happens
The attacker’s whole job is to not match your pattern.
URL encoding, double encoding, comments splitting keywords apart (UNION/**/SELECT), mixed case, injected control characters. The same payload has dozens of appearances in the log. So the regex is never written once — it’s written and revised.
And the moment you write it, the opposite problem arrives: false positives. A site search with or in the query string. An article title containing union. select is an ordinary English word. Most hits are harmless, and confirming that they’re harmless means reading each one in context.
There’s also a distinction that matters legally: an attempt is not a success. Whether it worked shows in another field on the same line (status code, response size) and in the lines that follow — an unnaturally regular burst of requests from the same address.
What general tools do, and where they stop
Cast wide, then narrow.
grep -Ei "union[[:space:]/*]+select|'[[:space:]]*or[[:space:]]*'1'?=|sleep\(|benchmark\(" access.log | head -50
# decode first, twice, to catch double encoding
perl -pe 's/%([0-9A-Fa-f]{2})/chr(hex($1))/ge' access.log | grep -Ei 'union.*select' | head
# did that address get a 200 back?
grep '203.0.113.77' access.log | awk '{print $9, $10}' | sort | uniq -c
The decode step works. Multiple encoding layers give way to simply running the substitution more than once.
Three limits. First, once decoded, it isn’t the original any more. What flows down the pipe is transformed text with no line numbers attached to it. When it’s time to quote a specific request in a report, you go looking for where it actually was — the same problem part 9 described as “the moment you transform it, it stops being the original.”
Second, tuning a regex means re-reading everything, repeatedly. Cutting false positives is ten or twenty rounds of adding and removing conditions, each one a full pass over gigabytes. And the count at each stage isn’t kept, so you can’t tell which condition did the work. A visible drop — 94,979 → 184 → 54 — answers that instantly, but a pipeline throws its intermediate state away.
Third, “did it succeed” can’t be written as one grep. The status code is on the same line; the follow-on behaviour is on other lines. No single pipeline sees both, so you end up shuttling between the hit list and the scene.
4. Inventorying personal data — one person is not one key
Situation
An erasure request arrives. Or there’s a suspected breach and you need to identify who was affected. The ask is: “produce every trace of this person.” There’s a deadline.
The logs span years, tens of gigabytes, several systems.
Why it happens
In a log, one human being appears as several unrelated strings.
A member ID, an email address, the email address they used before they changed it, a phone number, a session ID, whatever IP they happened to hold that day. Search any one of them and the lines written with the others stay hidden. And the awkward part: the keys grow as you work. A line found by email contains a session ID you didn’t know about; searching that turns up another identifier.
The nature of the job matches the full inspection in part 13: to say “nothing,” you have to go through all of it. Answering “we found no records” requires being able to state which range you checked under which conditions.
And one more constraint: the subject matter is personal data. Uploading it somewhere to search it is largely off the table.
What general tools do, and where they stop
Build a key list and apply it in one pass.
grep -h -F -f keys.txt access.log auth.log app.log | tee hits.txt | wc -l
# harvest identifiers you didn't know about yet
grep -o -E 'sid=[A-Za-z0-9]{16}|[A-Za-z0-9._%+-]+@[A-Za-z0-9.-]+' hits.txt | sort -u
# keep filename and line number, for the report
grep -n -H -F -f keys.txt *.log > evidence.txt
grep -F -f is the workhorse here: dozens of keys, matched as fixed strings, in one pass. And -n -H in the third command is basic hygiene for anyone who has to write the report.
Two limits. First, every new key restarts everything. One identifier discovered means appending to keys.txt and running the whole corpus again — and identifier chains tend to branch rather than terminate.
Second, what you looked at doesn’t persist. Shell history dies with the terminal. Assembling “which conditions, which range” the day before the deadline, from memory, is how people end up redoing the whole thing. On this job the search conditions are part of the deliverable, and general-purpose tools have nowhere to keep them.
What all four had in common
| View | What you’re looking for | Constraint | Where general tools stop |
|---|---|---|---|
| Lateral movement | A chain of identifiers that changes hands | Follow four files at once | Every round trip re-reads; order can’t be expressed |
| Ransomware, after the fact | The window just before encryption | Preservation; stay local | Re-decompresses per query; the window can’t be sized up front |
| SQLi that got past | Attempts, and whether any succeeded | Citations need original coordinates | Decoding drops the coordinates; per-stage counts vanish |
| Personal data inventory | Several keys pointing at one person | Can’t leave the machine; deadline | Every new key restarts; conditions aren’t kept |
The second column has nothing in common. Neither does the third. The fourth lines up anyway, because all four are asking for the same three operations.
- Search by order.
VPN success → ticket → another host;bulk read → archive → outbound. The trace of an attack is in the arrangement of terms, not the set of them. - Stack the narrowing and see the count at each stage. Neither regex tuning nor key expansion finishes in one pass. When the drop is visible, the condition that did the work is obvious.
- Keep the original’s coordinates, and stay on the local machine. A citation needs a filename and a line number; the data can’t leave. Work on the original, not on a transformed copy.
All three are things anyone does without thinking on a small file. At tens of gigabytes, each round trip demands a full re-read, decoding erases the coordinates, and the conditions die with the terminal. The operations aren’t hard; size is what stops them being worth their cost. This series keeps arriving at that sentence — after the fact, it just comes with a deadline and a higher price for being wrong attached.
Back to those eleven minutes. Any tool will find them. What no tool hands you is the six days before.
The tool I use
UwView (free), which I develop, displays, scrolls, and searches huge text from the moment it opens. The index is built in the background and line numbers appear when it completes. Nothing is split and nothing is extracted, so a preserved log stays one file, unmodified. It never writes to the original — the first principle of forensics. Highlights add colour without removing lines, which is exactly section 3’s “set the harmless hits aside without deleting them.” All processing happens on your machine; the file is never transmitted anywhere.
The three operations above are what UwView Pro adds.
- Sequence search: match only where
w1 → w2 → w3appear in that order. Section 1’sVPN success → ticket issued → another hostand section 2’sbulk read → archive → outboundbecome the query itself. A right-click “history” shows the path that actually matched — which line held which term — and you can jump to any of them. One honest note: each stage searches the body starting from the previous stage’s position, so it takes about as long as a full-text search. Implementation write-up. - Drill-down search: narrow a result by another term, then another. Tabs show
term (count), so section 3’s regex tuning and section 4’s key expansion run with the count visible at every stage. Stages after the first search only the previous stage’s window, so there’s no wait, and backing out means clicking the earlier tab. Implementation write-up.
Here is what both of those actually look like.
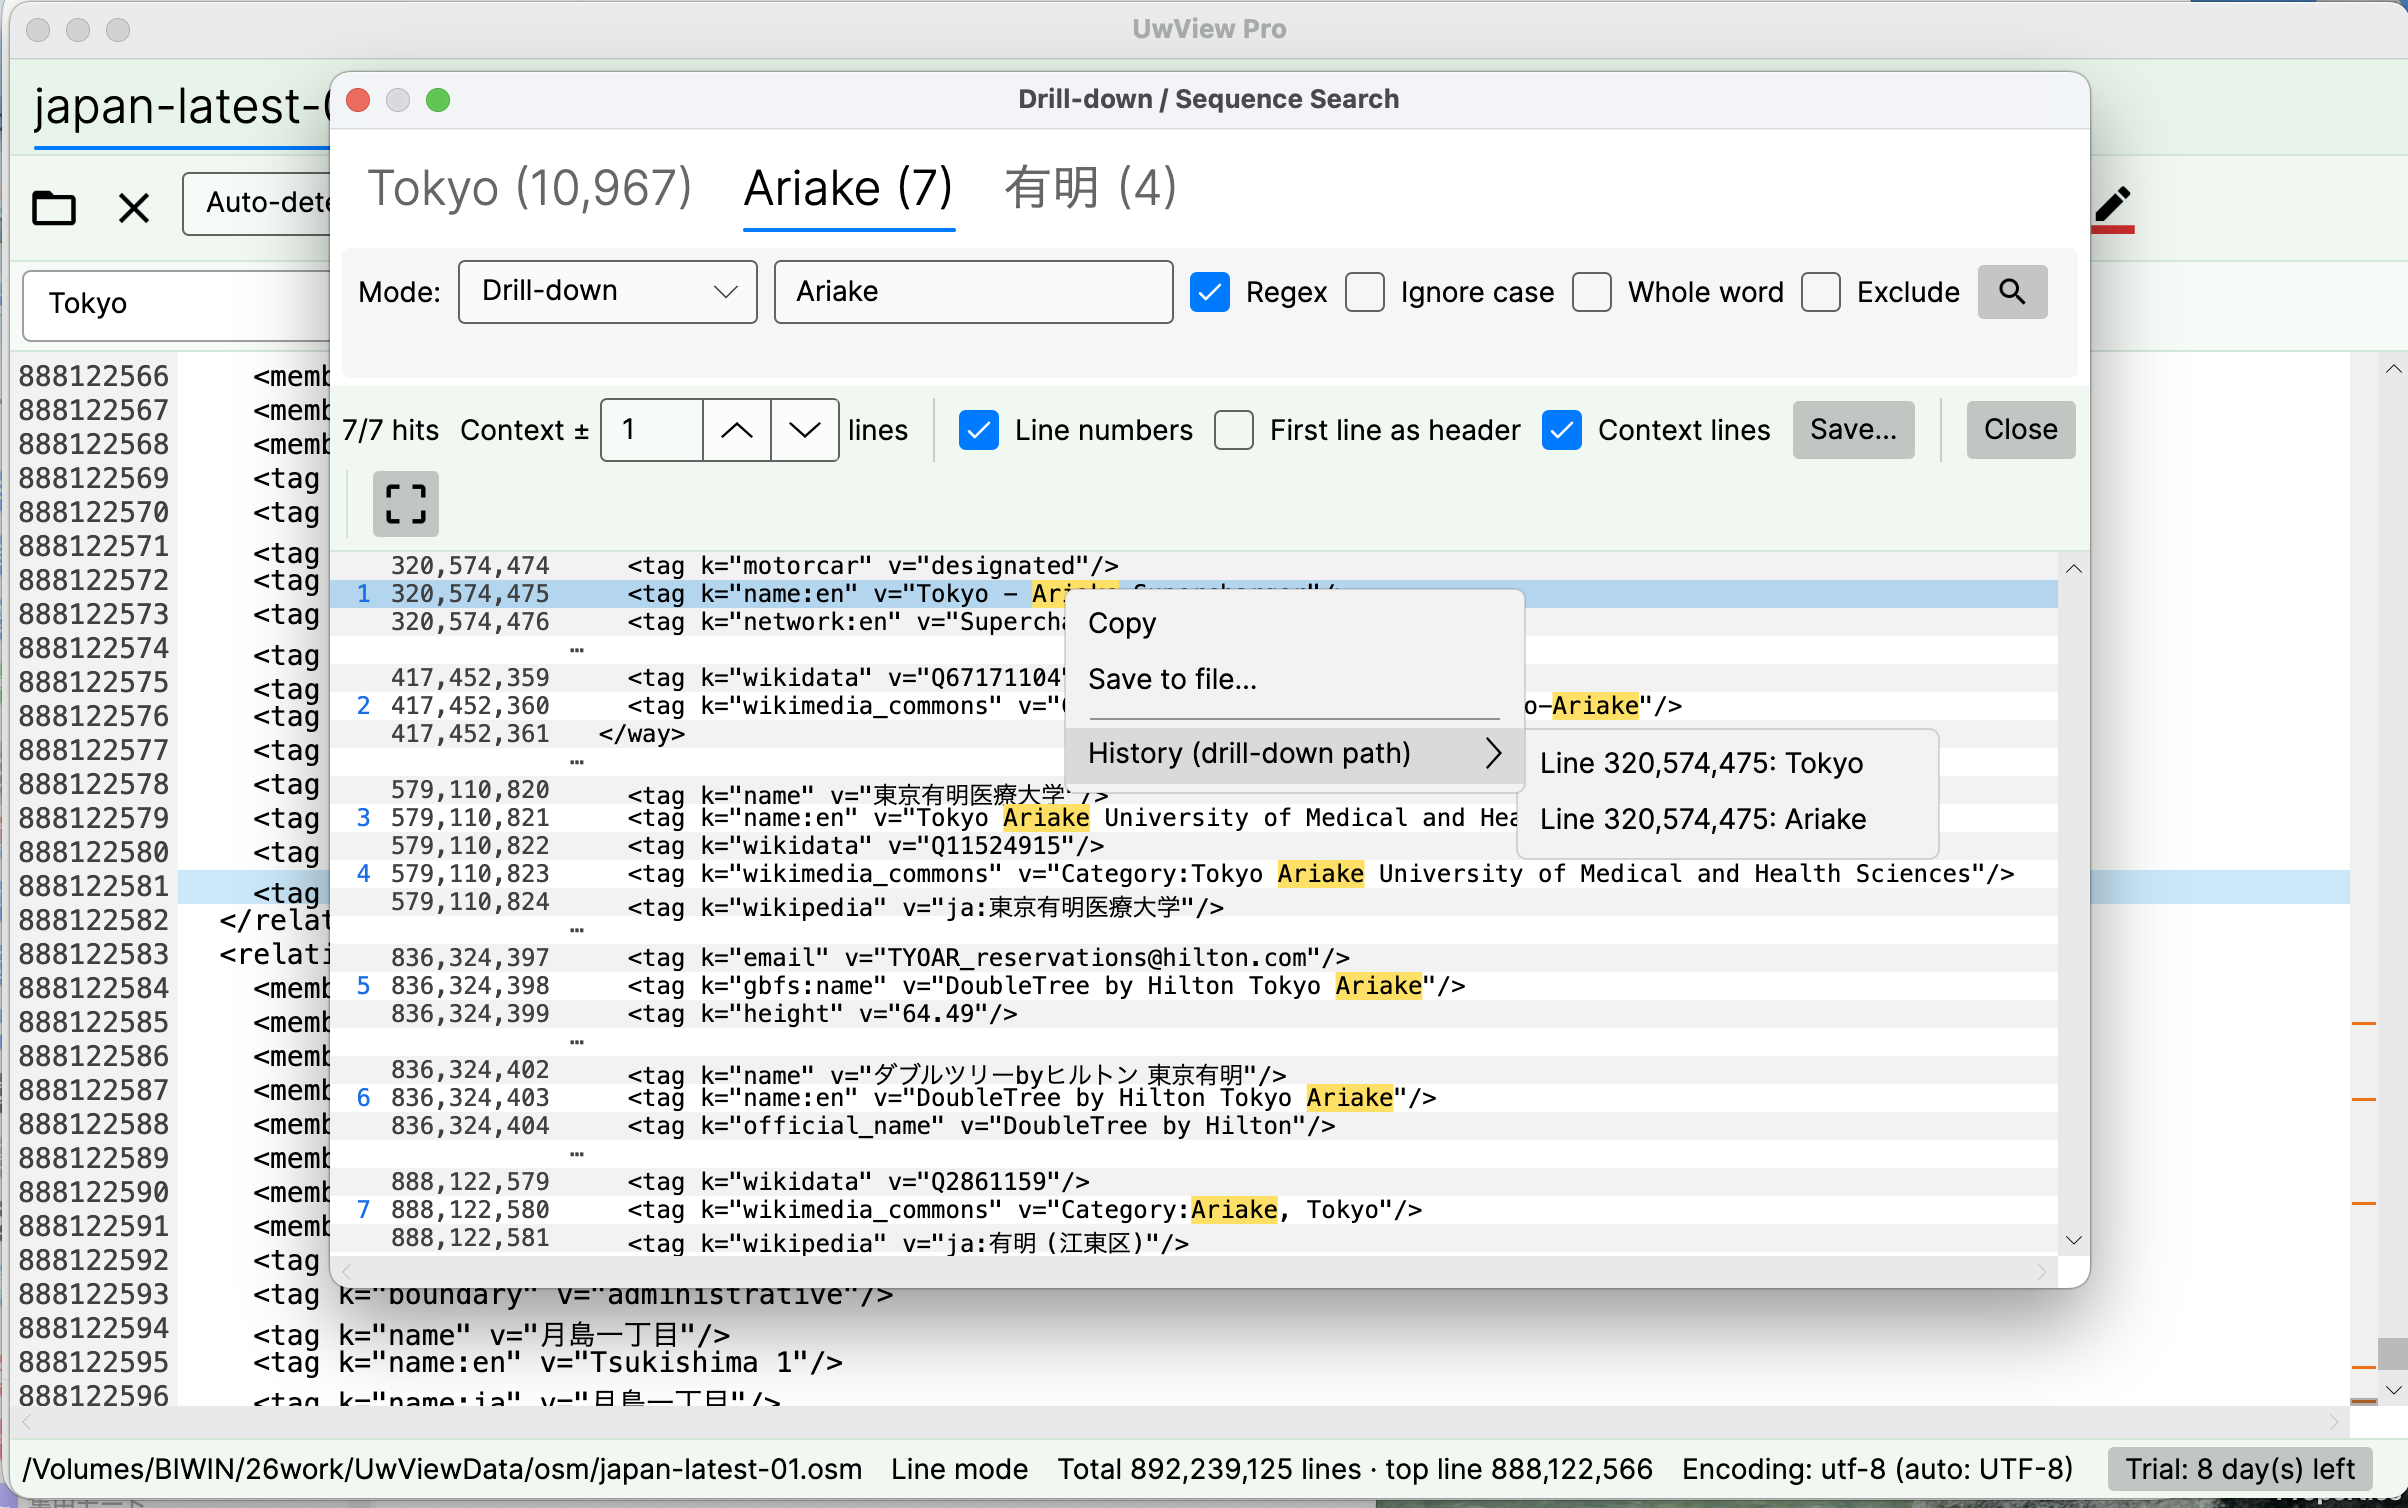
The tabs across the top — Tokyo (10,967) → Ariake (7) → 有明 (4), with counts — are section 3’s “how much did each stage remove.” The right-click History (drill-down path) — Line 320,574,475: Tokyo → Line 320,574,475: Ariake, term and original line number, in order — is section 1’s “which term caught this, and where did it come from.” (The screenshot is 892 million lines of OSM data; logs behave the same way.)
Set against a grep pipe, what survives is different.
grep A file \| grep B \| grep C |
Drill-down + history | |
|---|---|---|
| Per-stage counts | Gone — only the final result | Tabs carry term (count) |
| Original line numbers | Lost from stage 2 on (grep -n counts within the block that reached it) |
Still 320,574,475 — and you can jump there |
| Which term caught the row | Unknowable | Listed in History, term and line number, in order |
| Changing a condition | Rewrite the pipe, re-read the file from the top | Click the tab of the stage you want back |
| Stopping for the day | Close the terminal and the conditions and the path go with it | Tabs and history persist; resume there tomorrow |
Section 4’s “what you looked at doesn’t persist” is rows 1 and 5 of that table. On work where the search conditions are part of the deliverable — an erasure-request answer, an after-the-fact report — that difference lands directly on the number of days and on how hard the report is to write.
- ±N is independent per stage: ±1 while narrowing, ±10 on the stage where you actually read — and changing N doesn’t re-read the original. That’s section 2’s “you can’t size the window up front.”
- It saves the index and the compression: from the second open onward the file opens instantly, with line numbers (0.02–0.07 s measured on a 47.73 GB text file; one setup, results vary). Compressed-cache search and ~1/9 storage come with it, so retention-mandated logs cost less disk (all OS, one-time or monthly). On section 2’s kind of work — the same preserved tens of gigabytes, reopened for days — that difference shows up in the schedule.
One honest set of limits: UwView is a viewer. It is not a SIEM and not a forensic suite. No automated cross-log correlation, no threat-intel matching, no alerting, no report generation. It will not write section 3’s regex for you, it does not normalise the timestamps in section 1, and it does not join files automatically — putting them side by side is still your eyes doing the work. Disk images and memory dumps are out of scope entirely. What it covers is the step before all of that: looking at a preserved raw log, as it is, locally, with your own eyes. If your scale calls for correlation and alerting, that’s a different product’s job.
For completeness: non-destructive diff editing (Edit Upgrade) exists as a separate licence, but every one of the four views above is read-only work — what you need here is the View side.
Links
- Part 1: four go-to tools that sink under huge files: https://uvp.y42u.net/en/blog/uwview-ps01-huge-file-tool-limits-en/
- Part 2: four ways to trace causality in logs: https://uvp.y42u.net/en/blog/uwview-ps02-log-causality-tracing-en/
- Part 4: deciding between delete, keep, and compress: https://uvp.y42u.net/en/blog/uwview-ps04-log-retention-decision-en/
- Part 6: picking traces out of tens of millions of auth-log lines: https://uvp.y42u.net/en/blog/uwview-ps06-intrusion-triage-auth-logs-en/
- Part 7: four ways to read a timestamp as a weapon: https://uvp.y42u.net/en/blog/uwview-ps07-timestamp-driven-triage-en/
- Part 8: keeping logs compressed and still searchable: https://uvp.y42u.net/en/blog/uwview-ps08-compressed-archive-search-en/
- Part 9: reading structured data raw: https://uvp.y42u.net/en/blog/uwview-ps09-read-raw-structured-data-en/
- Part 13: four techniques for inspecting huge data: https://uvp.y42u.net/en/blog/uwview-ps13-huge-data-inspection-en/
- Sequence search — finding only what appears in that order: https://uvp.y42u.net/en/blog/uvp-sequence-search-en/
- Drill-down search — narrowing a result by another term: https://uvp.y42u.net/en/blog/uvp-drilldown-search-en/
- Chasing 5xx in an nginx access log: https://uvp.y42u.net/en/blog/uwview-access-log-5xx-workflow-en/
- Source code (GitHub): https://github.com/amru195704/UwView
From the developer: a full list of my apps, Kindle books, and open-source work is on GitHub: amru195704.
A note
This article is provided for reference and makes no guarantee of accuracy or completeness. Actual incident response, evidence preservation, and personal-data handling must follow your organisation’s policy and applicable law and regulatory guidance. Times, counts, and identifiers shown here are illustrative and do not describe any real incident. All IP addresses are documentation-range examples. Log formats, field positions, and timestamp conventions vary widely by OS, middleware, product, and configuration. Command examples may need adjustment for your environment (GNU/BSD differences, shell,awk/grep/zgrepimplementations). Measured figures come from one specific setup and are not a guarantee of the same result. If you spot an error, a comment is welcome and I’ll check and correct it.