The second run is the OS being fast.
Search the same log twice and the second search often finishes in a blink. Read that as “this tool is fast” and you have made one wrong call: what got faster is the operating system’s file cache. The tool did exactly the same work the second time.
So how big is the gap, and how far should you trust it? And that cold number someone measured once — how much is it actually worth?
This part measures cold and hot five times each on a 1 GiB log, and publishes not just the medians but the spread across those five runs. The gap came out large. Large enough that it exposed a hole in the measuring, rather than in the tool.
- The short version: hot is about a twelfth of cold — but cold wandered 0.126 s across five runs, which is more than one whole hot run
- The problem: whose performance is “fast from the second run”?
- Test conditions
- Results
- The losses: the bigger the gap, the more the measuring shows
- Correctness: 40 runs, all ok, zero failures
- What you can take away: four habits for reading cold and hot
- How to write it with uvp
- Reproducing this
- Links
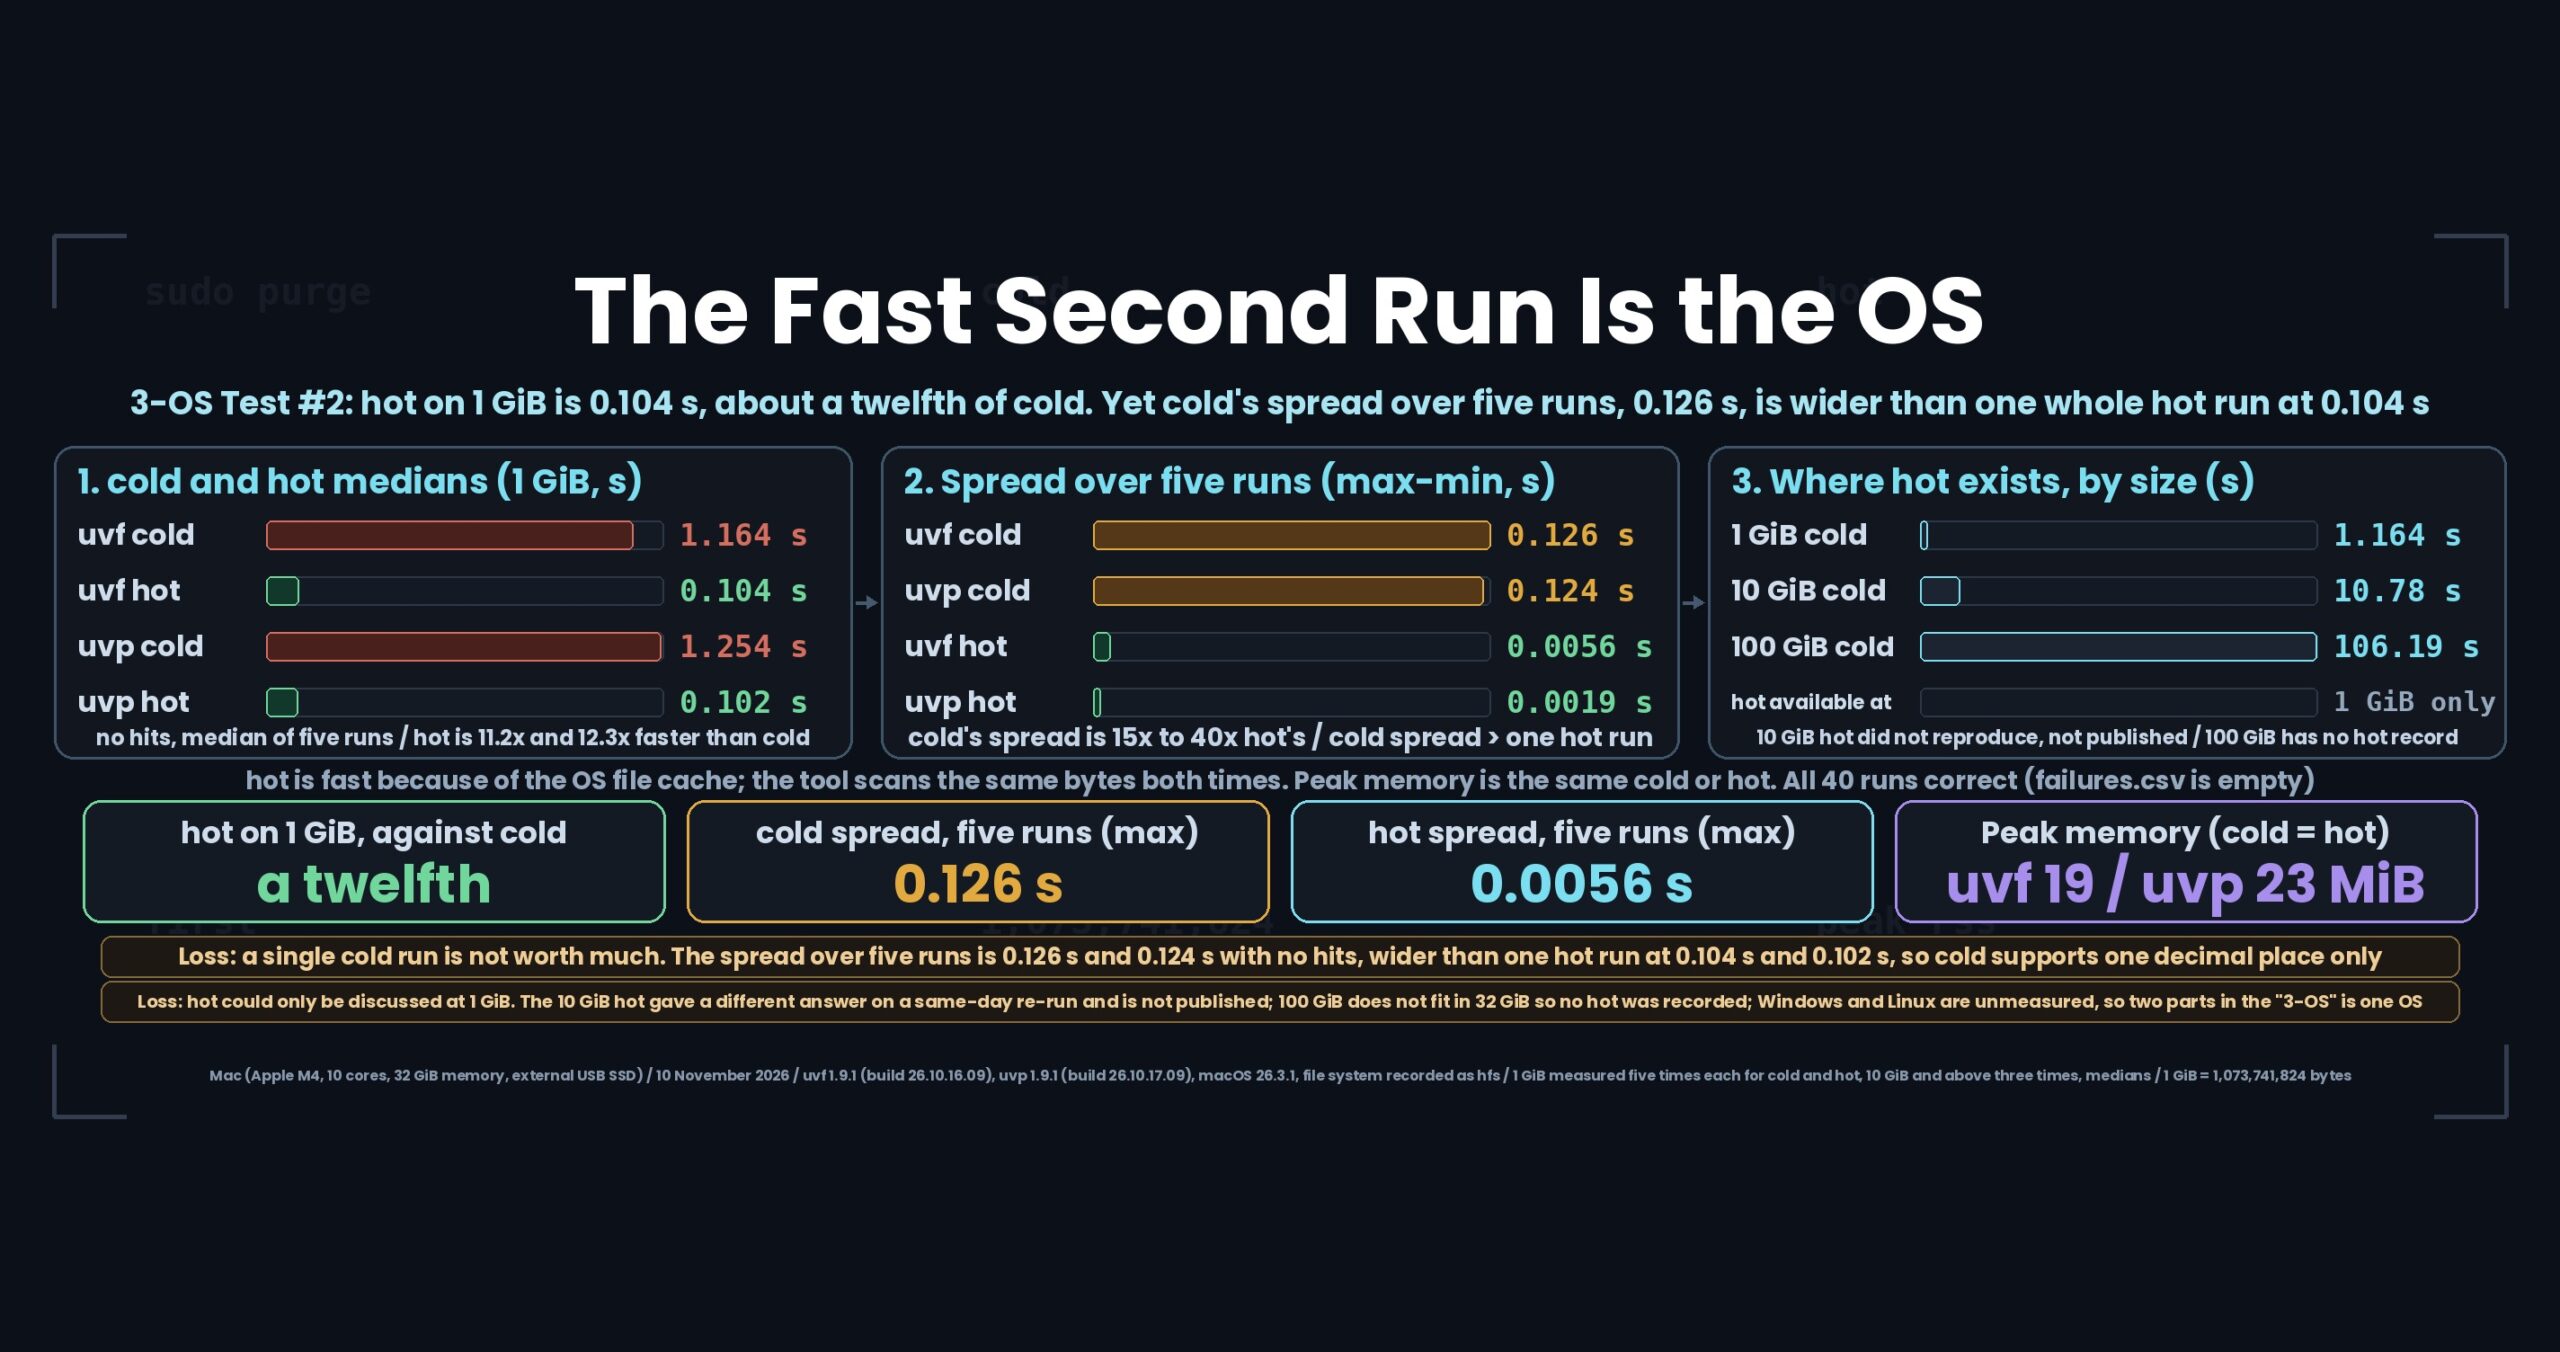
The short version: hot is about a twelfth of cold — but cold wandered 0.126 s across five runs, which is more than one whole hot run
The losses first.
One. A single cold measurement is not worth much. Five cold runs on 1 GiB with no hits landed between 1.126 and 1.251 s for uvf, and between 1.137 and 1.261 s for uvp — a spread of 0.126 s and 0.124 s. A single hot run on the same case takes about 0.102 to 0.104 s, so the measurement noise in cold is larger than an entire hot run. Measure cold once, get 1.13 s, publish it, and you have quietly reported a figure 1.03 times faster than the median.
Two. hot only exists for files that fit in memory. 100 GiB (107,374,182,400 bytes) does not fit in 32 GiB, so instead of a time the results CSV holds a skip: file does not fit in memory: hot is the same as cold. For 10 GiB, a re-run on the same day produced a different answer, so no 10 GiB hot figure appears here. 1 GiB was the only size where cold versus hot could be discussed at all.
With that said, here is what held up.
- hot on 1 GiB is about a twelfth of cold. uvf went from 1.16 s to 0.104 s (11.2 times faster than its own cold); uvp from 1.25 s to 0.102 s (12.3 times faster). With three hits in the file the ratios were 12.3 and 12.1 — essentially the same
- hot is far steadier than cold. The spread across five hot runs was 0.0019 to 0.0056 s, somewhere between a fifteenth and a fortieth of the cold spread (0.082 to 0.126 s). Reading from memory instead of disk leaves less room to vary
- Peak memory is identical for cold and hot. About 19 MiB for uvf and 23 MiB for uvp, on every run. The twelvefold speedup is not something the tool is holding on to
- “First run of the session” matched cold. Across four cases,
firstand the cold median differed by 1.00 to 1.09 times. The cold state built withsudo purgereally does reproduce a genuine first run - The free uvf and the paid uvp were level here. The widest gap was 1.08 times (uvf faster, 1 GiB cold with no hits), inside this series’ “under 1.5 times counts as level” line
uvfis the search command of the free UwView;uvpis the one in the paid UwView Pro. Every figure comes from result CSVs measured on 10 November 2026 on a Mac (Apple M4, 10 cores, 32 GiB memory, external USB SSD). Versions were uvf 1.9.1 (build 26.10.16.09) and uvp 1.9.1 (build 26.10.17.09) on macOS 26.3.1. This part is Mac only; Windows and Linux are not measured. How cold and hot are made, and how to read these numbers, was settled in part zero.Note on file-size notation: “1 GiB”, “10 GiB” and “100 GiB” here are bytes ÷ 1024³ — 1,073,741,824 / 10,737,418,240 / 107,374,182,400 bytes. macOS shows these as 1.07 GB / 10.74 GB / 107.37 GB in SI units (÷ 1000³).
The problem: whose performance is “fast from the second run”?
When you read a benchmark, the conclusion flips depending on whether you are looking at cold or hot.
hot is fast because the bytes the first run pulled off disk are still in the OS file cache, so the second run reads them from memory. The tool scans the same number of bytes the same way both times. A hot figure is therefore closer to “the ceiling when reading from memory” than to a property of the tool. Choose a tool by its hot numbers and everything looks roughly equal — which tells you nothing.
Looking only at cold has its own trap. cold is pinned to how fast the disk reads, so differences between tools are flattened there too, and because the cache has to be dropped before every run, the numbers wobble. Without knowing how much they wobble, you look at 1.13 s and 1.25 s, call it a ten per cent difference, and mistake noise for signal.
So this round ran cold and hot five times each against the same 1 GiB file and reports the minimum, maximum and spread alongside the median. It also records “first run of the session” (first) separately from the median, to check whether a cold state built with purge is really the same as a true first run.
Test conditions
Machines (Mac only this round)
| Machine label | What it is | Memory | Storage | File system | Kind |
|---|---|---|---|---|---|
mac-m4-32g-usbssd |
MacBook Air (Apple M4, 10 cores) | 32 GiB | External USB SSD | hfs (as recorded) |
Bare metal |
linux-vmware-fusion |
— | — | — | — | Not measured |
win11-16g |
— | — | — | — | Not measured |
macOS 26.3.1 (arm64), no virtualisation. The file system was recorded as hfs in the run’s env.json.
There are no Linux or Windows figures in this part. The series only takes fresh measurements on the Mac and reuses earlier numbers for the other two — but no earlier numbers exist for this cold-versus-hot test. The VMware allocation therefore does not apply here either. The original plan put “two bare-metal OSes and VMware” in the title; that has been cut back to one Mac.
Data
A UTF-8 log of lines carrying a timestamp, a level, a city name, an ID, a status and a path, laid down in 1 MiB units. The “three hits” variant has one UWTEST-NEEDLE line in the first, middle and last 1 MiB; the “no hits” variant has none.
| File | Bytes | GiB (÷ 1024³) | SHA-256 |
|---|---|---|---|
huge-1G.log |
1,073,741,824 | 1.00 | 984d3c2f49e9eaab… |
huge-10G.log |
10,737,418,240 | 10.00 | 4e223935919feedd… |
huge-100G.log |
107,374,182,400 | 100.00 | d9348a746b6a70eb… |
The data is not distributed. A seeded generator produces the same bytes on any OS; everything is verified by SHA-256 before being measured.
How it was measured
1 GiB was measured five times for cold and five for hot; 10 GiB and above three times. Medians are reported. cold means sync followed by sudo purge before every run; hot means one unrecorded warm-up run, then five recorded ones. “First run of the session” is kept as first, outside the median. A run counts as ok only when both the exit code and the hit count match what was expected.
Results
Table 1: cold and hot medians (1 GiB, Mac only, s)
| Case | uvf cold (s) | uvf hot (s) | uvp cold (s) | uvp hot (s) | How much faster hot is than the same product’s cold |
|---|---|---|---|---|---|
| No hits | 1.16 | 0.104 | 1.25 | 0.102 | uvf 11.2 times, uvp 12.3 times |
| Three hits | 1.24 | 0.101 | 1.24 | 0.103 | uvf 12.3 times, uvp 12.1 times |
Four combinations, all between 11.2 and 12.3 times. Neither the presence of hits nor the choice of free or paid version moved the ratio much.
Table 2: spread across five runs (1 GiB, Mac only, s)
| Case | cold min | cold median | cold max | cold spread | hot min | hot median | hot max | hot spread |
|---|---|---|---|---|---|---|---|---|
| uvf, no hits | 1.126 | 1.164 | 1.251 | 0.126 | 0.1035 | 0.1040 | 0.1091 | 0.0056 |
| uvp, no hits | 1.137 | 1.254 | 1.261 | 0.124 | 0.1014 | 0.1020 | 0.1033 | 0.0019 |
| uvf, three hits | 1.172 | 1.241 | 1.256 | 0.085 | 0.1007 | 0.1013 | 0.1028 | 0.0021 |
| uvp, three hits | 1.168 | 1.242 | 1.250 | 0.082 | 0.1004 | 0.1029 | 0.1053 | 0.0049 |
This table is the point of the whole round. In the two no-hit cases the cold spread (0.126 s, 0.124 s) is wider than one entire hot run (0.104 s, 0.102 s). In the three-hit cases the spread narrows to 0.082–0.085 s, about 0.8 of a hot run. Either way, writing a cold figure to two decimal places off a single run is not defensible.
hot sits in another league. Its widest spread is 0.0056 s, or 5.4 per cent of the median; cold’s spreads run 6.6 to 10.8 per cent of theirs.
Table 3: is “the first run” the same as cold? (1 GiB, Mac only, s)
| Case | first (one run, s) | cold median (s) | Direction |
|---|---|---|---|
| uvf, no hits | 1.14 | 1.16 | first is 1.02 times faster (level) |
| uvp, no hits | 1.31 | 1.25 | first is 1.05 times slower (level) |
| uvf, three hits | 1.24 | 1.24 | the same (1.00 times) |
| uvp, three hits | 1.14 | 1.24 | first is 1.09 times faster (level) |
All four differences sit inside cold’s own spread, two leaning fast and two leaning slow, with no bias either way. Dropping the cache with sudo purge genuinely rebuilds the first-run state. It is an unglamorous check, but if it failed, every cold number in the series would fail with it.
Memory does not change on the second run
Peak memory was about 19.3–19.4 MiB for uvf and 23.3–23.4 MiB for uvp, cold or hot, on every one of the five runs. The second search runs twelve times faster and the tool uses not one extra byte, because the speedup lives in the OS cache: from the tool’s side, the disk simply got faster.
About 10 GiB and 100 GiB
| Case | uvf cold (s) | uvp cold (s) | hot |
|---|---|---|---|
| 10 GiB, no hits | 10.78 | 10.75 | no figure published |
| 10 GiB, three hits | 10.68 | 10.67 | no figure published |
| 100 GiB, no hits | 106.19 | 106.19 | not recorded (skip) |
| 100 GiB, three hits | 107.17 | 106.21 | not recorded (skip) |
For 100 GiB the CSV carries file does not fit in memory: hot is the same as cold where a time would go. A file that cannot fit in the cache has no hot state at all, so every open is a cold open.
For 10 GiB, a re-run on the same day came back with a different answer. A 10 GiB file ought to fit in 32 GiB of memory, but whether it actually does on a given day is the OS’s decision, not ours. Since neither value would reproduce for a reader, this series publishes neither.
The losses: the bigger the gap, the more the measuring shows
One. A single cold run only supports one decimal place.
When five runs span 0.082 to 0.126 s, writing “1.16 s” really claims “somewhere in the 1.1s to 1.2s”. Five runs here made a median possible — but assume any cold figure from a one-shot benchmark is off by around ten per cent. That applies to reading other people’s numbers and to publishing your own.
Two. This round fell outside its own title in two ways.
The first is size. cold versus hot could only be shown at 1 GiB: 10 GiB would not reproduce, and 100 GiB has no hot to begin with. “Fast from the second run” turns out to be a statement about files that fit in physical memory.
The second is the OS. This is one Mac; Windows and Linux are unmeasured. The round this was meant to be would have put “how cold is made differently on bare-metal macOS and Windows” next to “how much a VMware Linux guest wobbles because of host-side caching” — and those numbers do not exist yet. Two parts in, the “3-OS” in the series name is still one OS.
Three. There are no GUI or web-version figures. Only command-line times. Whether reopening in the window is faster the second time is not something this article can answer.
Correctness: 40 runs, all ok, zero failures
Before the speed, the answers.
Across the four 1 GiB combinations (uvf/uvp × no hits/three hits), all 40 runs — five cold and five hot each — came back ok. failures.csv holds its header row and nothing else.
- The no-hit cases exited 1 with no output lines, all ten times
- The three-hit cases returned all three lines from the first, middle and last 1 MiB and exited 0, all ten times
- No run changed its answer between cold and hot. It only got faster
“Faster, but the answer moved” is the nastiest kind of benchmark accident, and a condition like hot — where the bytes arrive by a different route — is exactly where it hides. Checking the hit count and exit code on every run is what catches it; here that check ran 40 times.
Incidentally, the series’ weak-point list currently has ten entries, and this test added none. All ten concern character encodings, line endings, Japanese characters and malformed input, and are covered from part four onward.
What you can take away: four habits for reading cold and hot
One. Read cold as a range. When you see a lone cold median, assume roughly ten per cent of play around it; a difference under 1.5 times may be entirely inside that. When measuring, do at least three runs and publish the minimum and maximum too — that alone lets a reader separate noise from signal.
Two. hot flattens differences between tools. The second run is fast because of the OS file cache, which helps every tool equally. Choose tools on cold numbers; use hot to describe what the second query feels like.
Three. Include one size larger than physical memory. Measure only within what fits and you may end up claiming “fast from the second run” when it isn’t true. Above physical memory the cache effect essentially disappears, so for those sizes, assume the cold figure is the real one. And at the borderline size — 10 GiB here, big enough that it might or might not fit — the honest option can be to publish no figure at all.
Four. Watch peak memory in both states. It tells you who earned the speedup. If memory did not grow, the OS cache did it, not the tool. /usr/bin/time -l on macOS or /usr/bin/time -v on Linux will show you.
How to write it with uvp
These are the exact invocations used. There is no cold or hot option — the same command runs, with the cache in a different state.
Dropping the cache to build a cold run, on macOS:
# cold: drop the cache, then measure once
sync && sudo purge
/usr/bin/time -l uvf huge-1G.log UWTEST-NEEDLE
The paid version is the same line with a different command name.
# cold (paid version)
sync && sudo purge
/usr/bin/time -l uvp huge-1G.log UWTEST-NEEDLE

# hot: one warm-up run, then measure
uvp huge-1G.log UWTEST-NEEDLE > /dev/null
/usr/bin/time -l uvp huge-1G.log UWTEST-NEEDLE
For the no-hit case, pass a term the file does not contain. The exit code becomes 1.
uvf huge-1G.log UWTEST-ABSENT; echo "exit=$?"
uvp huge-1G.log UWTEST-ABSENT; echo "exit=$?"
Add -E for a regular expression (-H prefixes each hit with the file name).
uvf huge-1G.log 'UWTEST-[A-Z]+' -E -H
uvp huge-1G.log 'UWTEST-[A-Z]+' -E -H
The free version comes from GitHub Releases (brew install --cask amru195704/uwview/uwview on Mac, Scoop on Windows, Snap on Linux).
Reproducing this
The procedure lives in the public repository. If this article and the repository disagree, the repository is right.
- How the numbers are read and how cold and hot are built: https://github.com/amru195704/UwView/blob/main/testsuite/docs/00-rules.md
- The huge-file procedure this test comes from: https://github.com/amru195704/UwView/blob/main/testsuite/docs/01-huge.md
- The weak-point list: https://github.com/amru195704/UwView/blob/main/testsuite/weak-points.md
- The suite itself: https://github.com/amru195704/UwView/tree/main/testsuite
To run it yourself, generate the data with tools/gen.py, verify it with tools/check.py data, then run tools/run.py. A few GB of working space is enough for the 1 GiB case alone. The results folder itself is not public as of this article; a link will follow once it is.
Links
- Part zero (how cold and hot are made, and how to read these numbers): https://uvp.y42u.net/en/blog/uwview-xt00-rules-en/
- Part one (1 GiB to 100 GiB, and 100 million to a billion lines): https://uvp.y42u.net/en/blog/uwview-xt01-1gb-to-100gb-en/
- Where the second search of a 10 GB file saves its time: https://uvp.y42u.net/en/blog/uwview-fs04-10g-second-search-en/
- All measured results: https://uvp.y42u.net/en/benchmarks-en/
- Source code (GitHub): https://github.com/amru195704/UwView
Part three takes on the huge single line: a file with one 100 MB line and no line breaks, and what that does to display and search.
And if you keep searching the same huge logs for the same handful of terms, UwView Pro makes the second query a step faster without depending on the OS cache — a persistent index, search inside the compressed cache, and roughly a ninth of the storage (every OS, one-time purchase or monthly subscription, 14-day free trial; see the pricing page).
From the developer: my apps, Kindle books and public projects are listed at GitHub: amru195704.