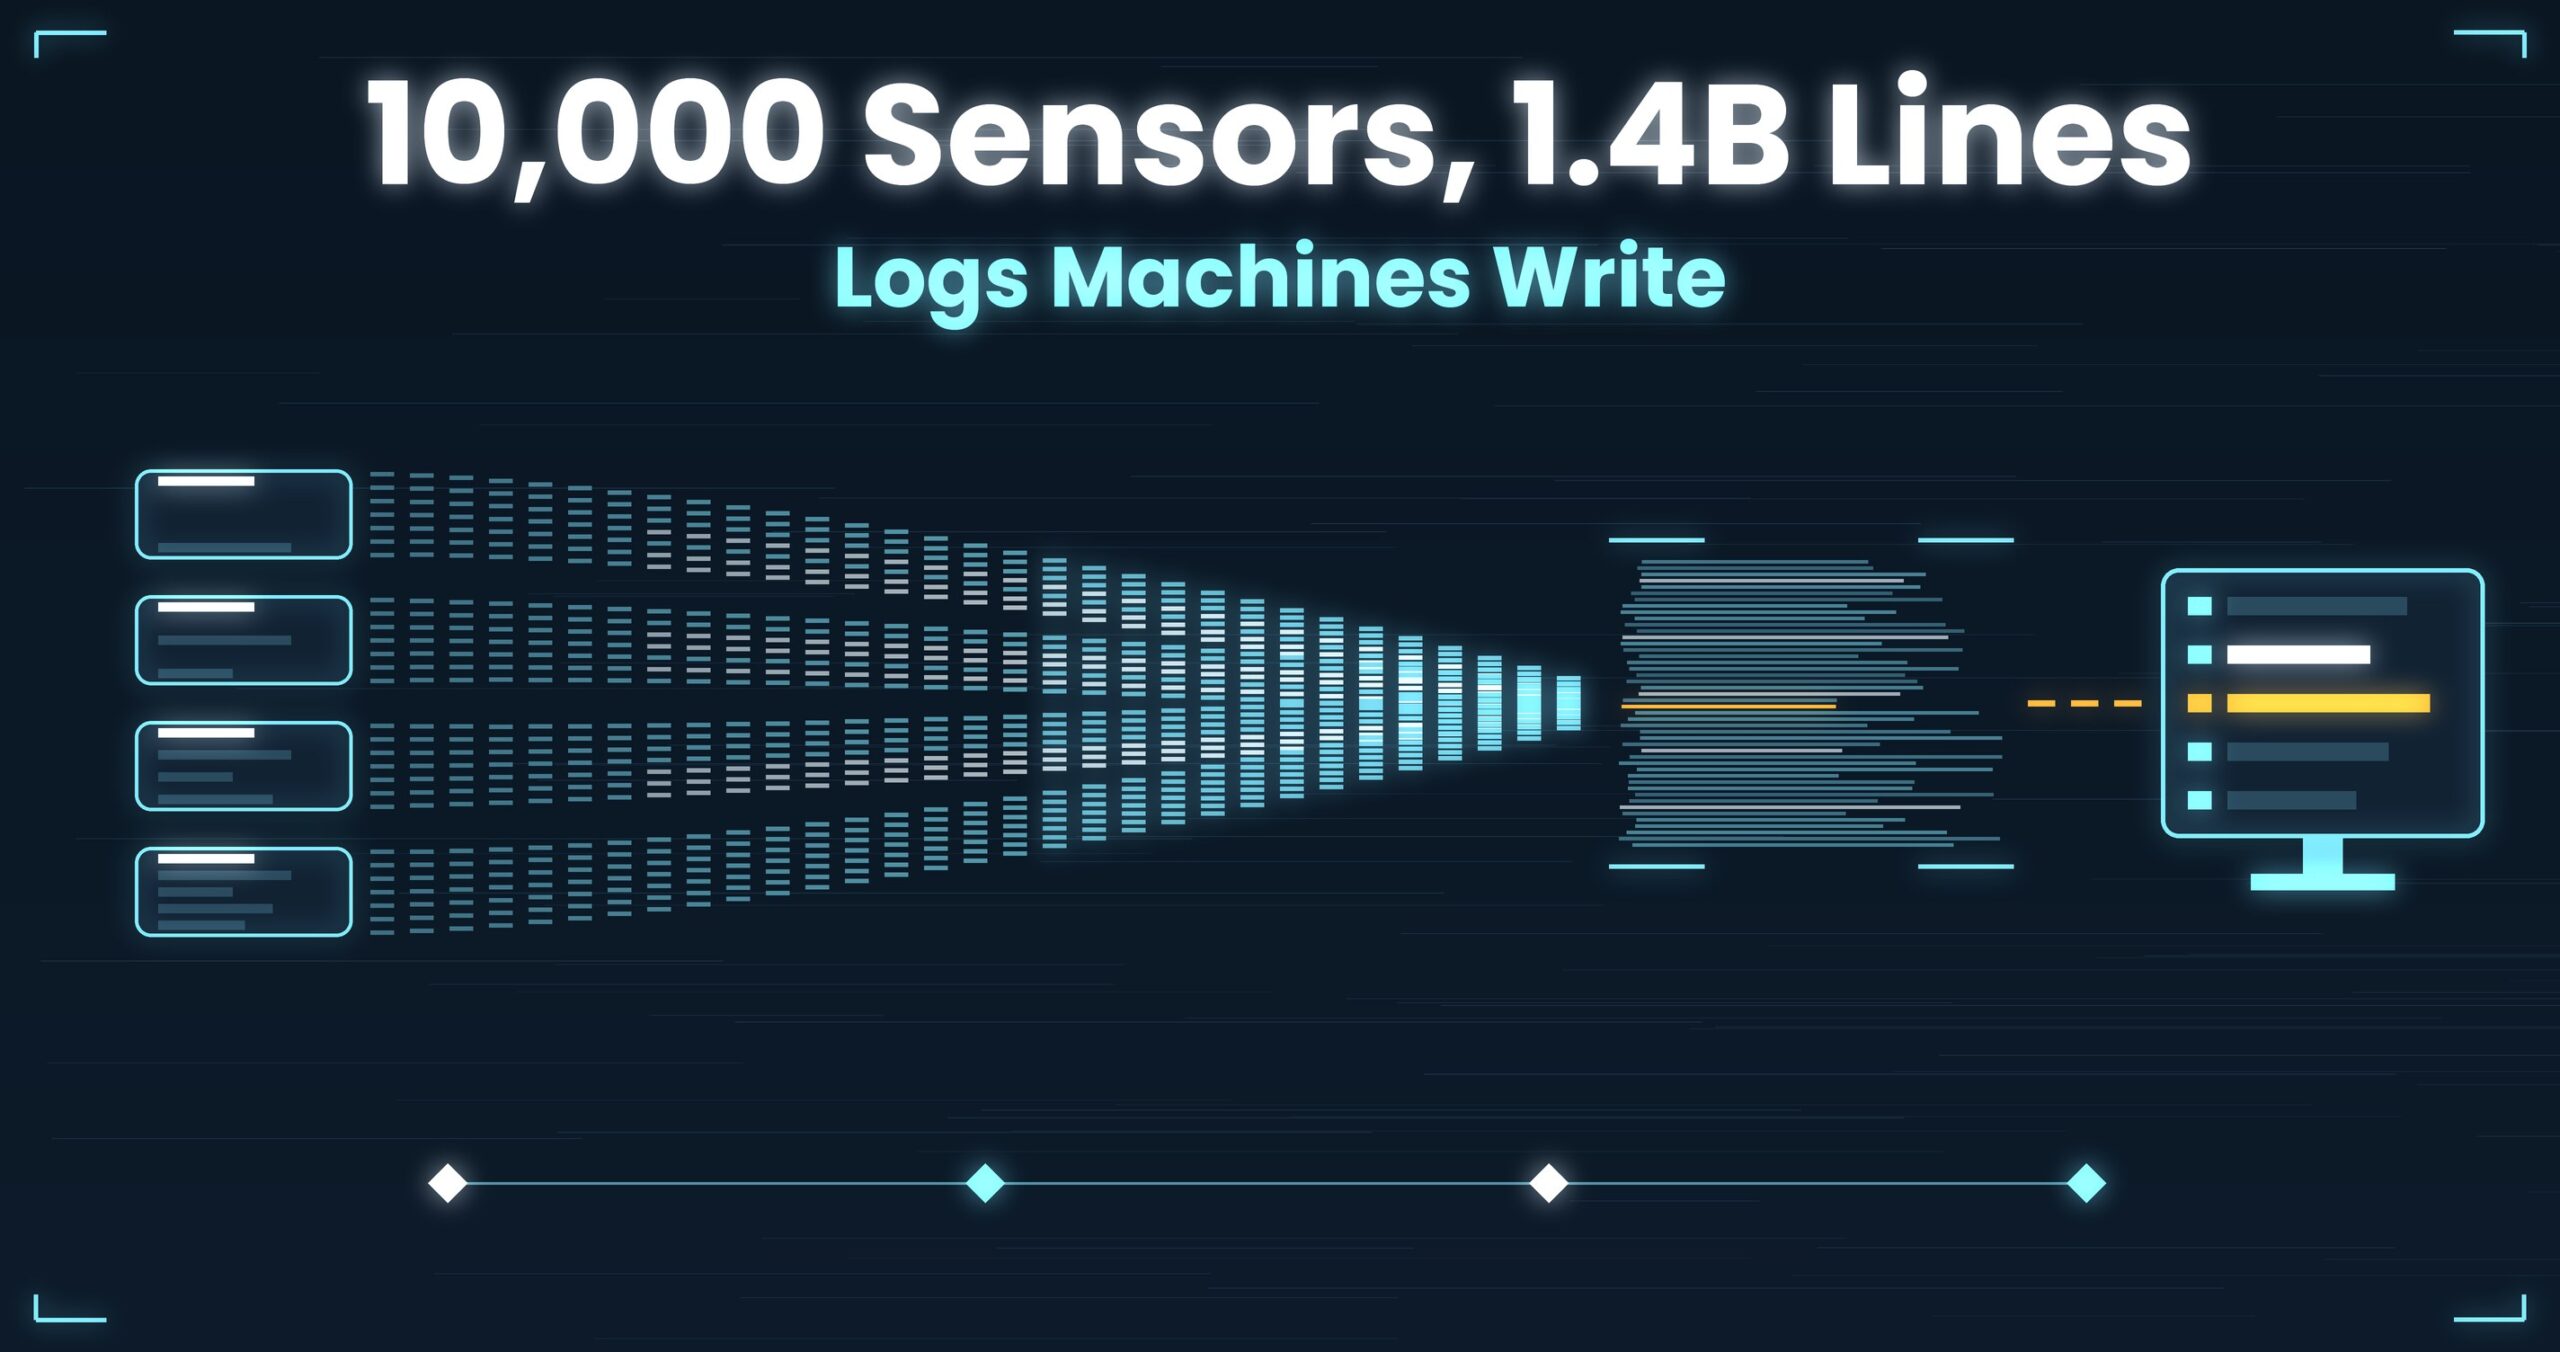
1.44 billion lines. In one day.
That’s what ten thousand sensors produce when each one emits 100 metrics, one per line, every minute. The fault is in one of those sensors, during one of those minutes.
Four fields, four ways of looking for it: IoT, medical devices, PLCs on a factory line, and research simulation output. Completely different worlds — and they get stuck in exactly the same place.
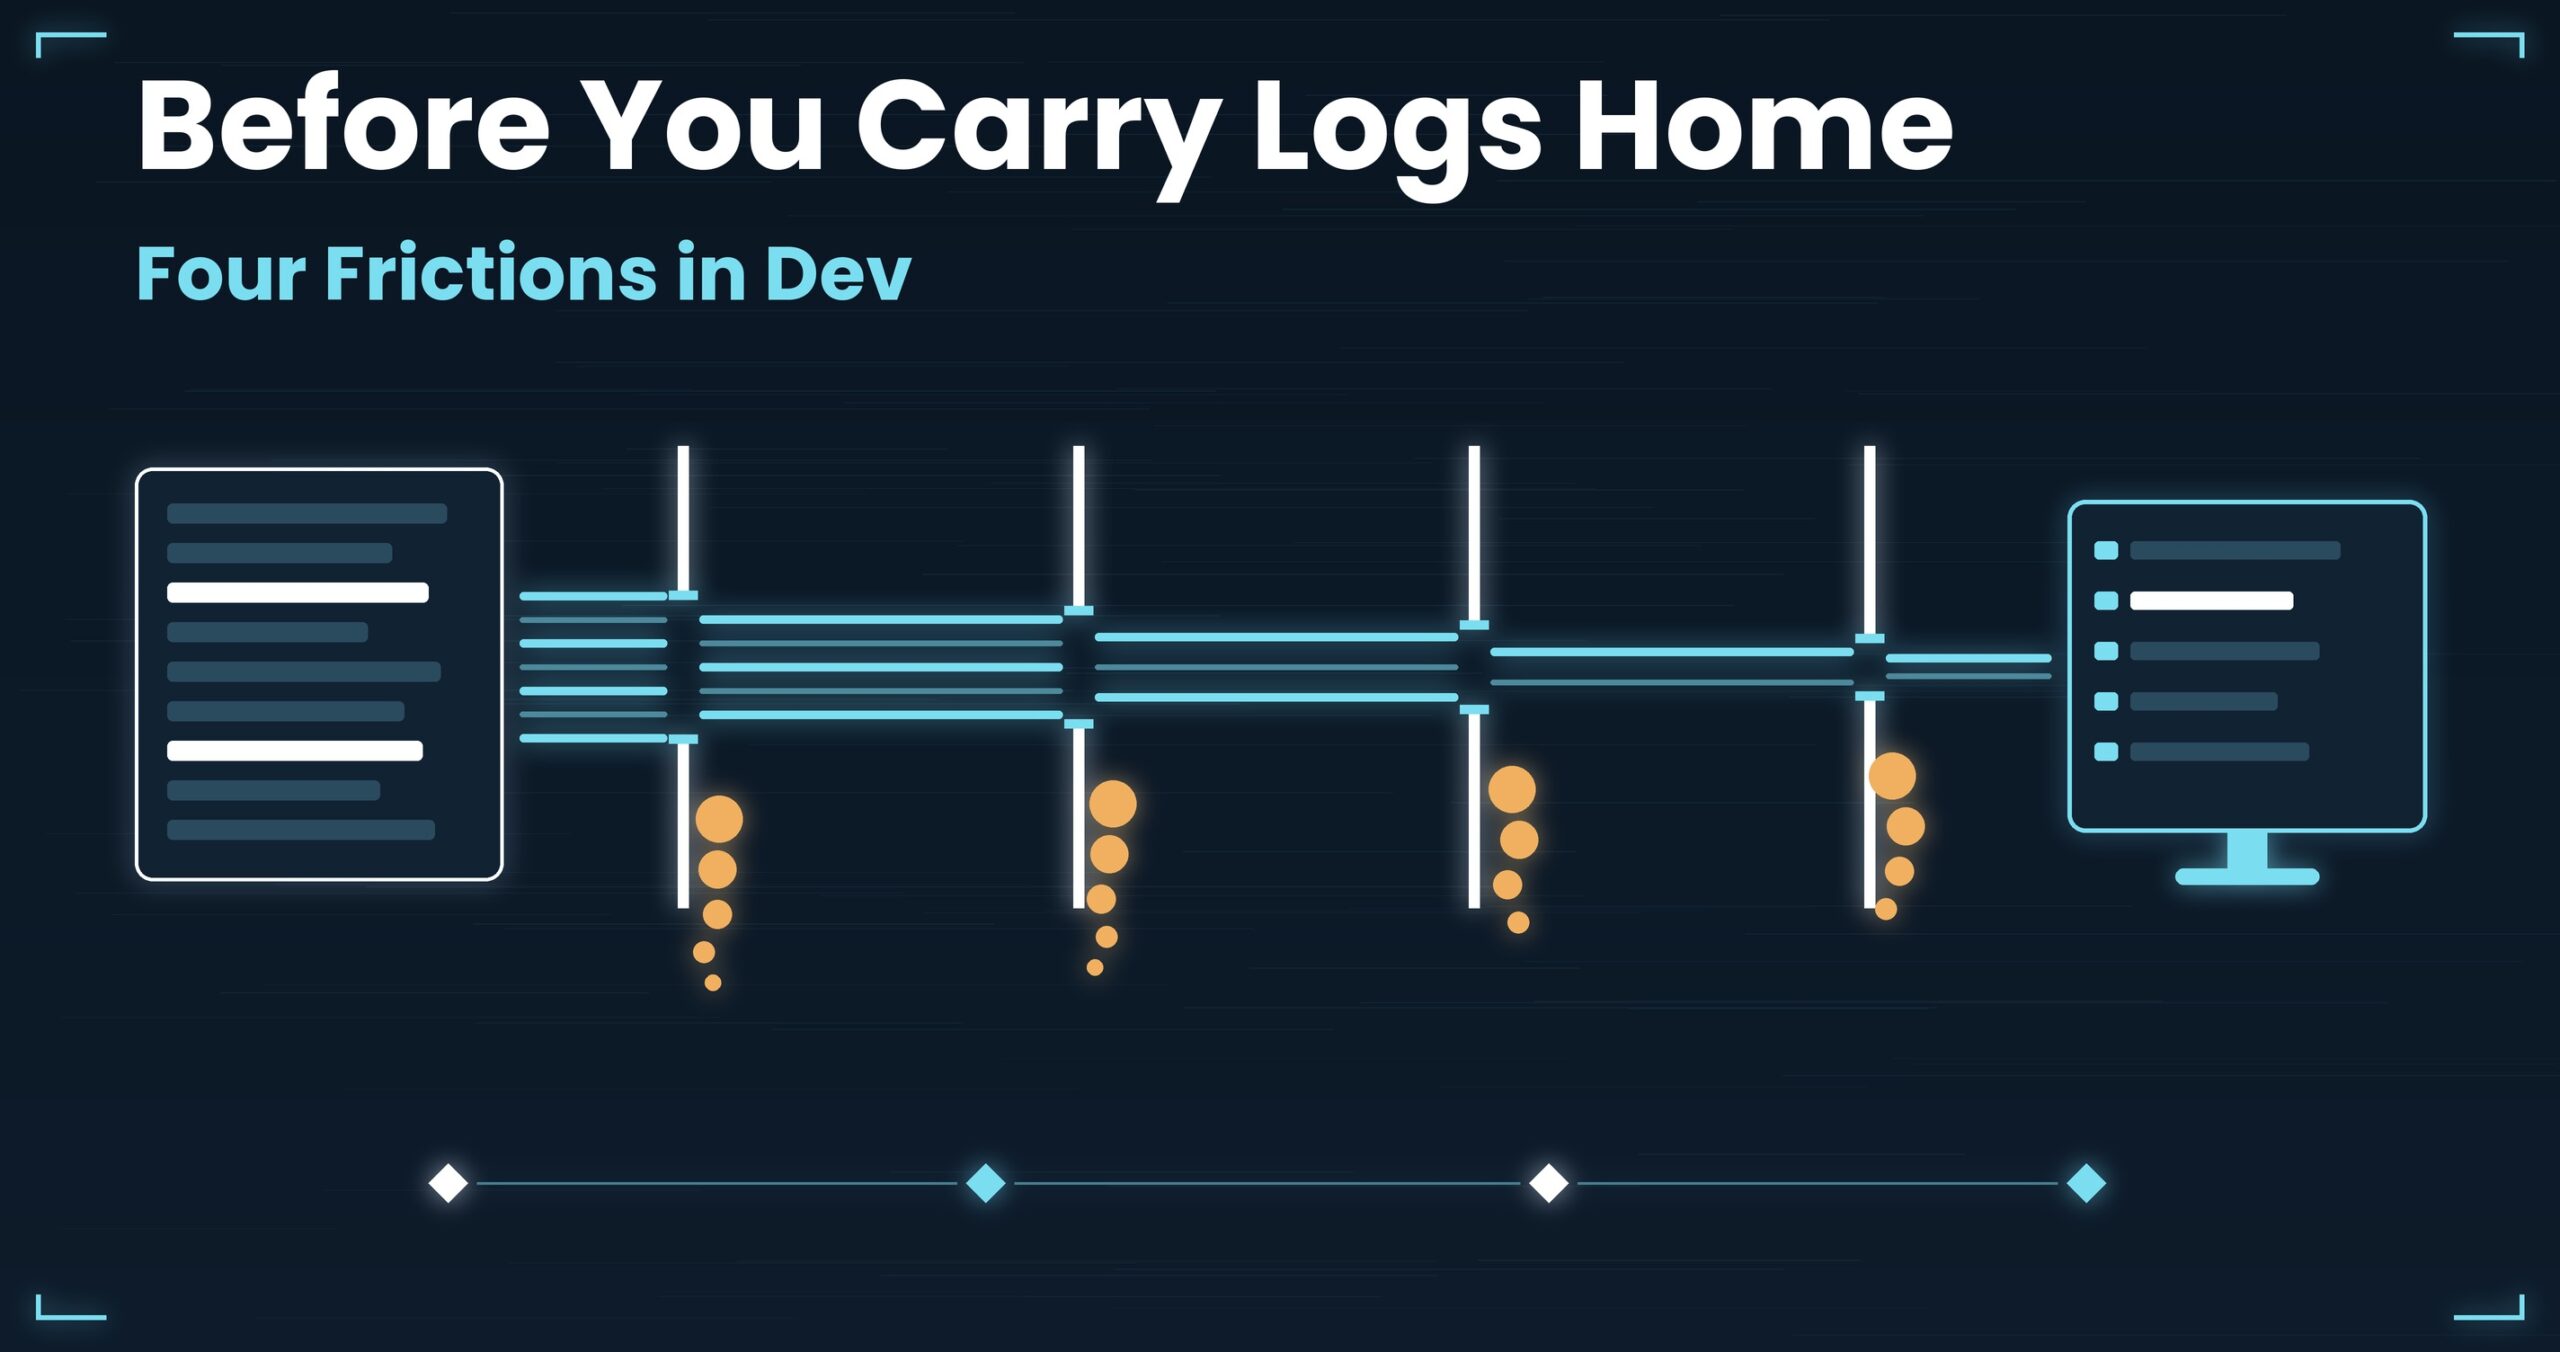
Unlike logs a person wrote, logs a machine writes were never meant to be read. That single fact produces all four problems.
- Up front: UwView Pro opens a 258.68 GB, 4.5-billion-line log and displays and searches all of it from the moment it opens, so even when line counts multiply out as devices × metrics × frequency you can follow the original, unsplit, by eye. It saves the index and the compression, so the second open comes back instantly with line numbers, and the file stays searchable at roughly 1/9 the storage (measured on one specific setup; results vary — details at the end)
- 1. IoT: line count is devices × metrics × frequency
- 2. Medical: doing the first-pass triage in-house instead of handing it to the vendor
- 3. Manufacturing: the PLC alarm history won’t open in the vendor’s own software
- 4. Research: look at the raw values before you plot them
- What all four had in common
- The tool I use
- Links
Up front: UwView Pro opens a 258.68 GB, 4.5-billion-line log and displays and searches all of it from the moment it opens, so even when line counts multiply out as devices × metrics × frequency you can follow the original, unsplit, by eye. It saves the index and the compression, so the second open comes back instantly with line numbers, and the file stays searchable at roughly 1/9 the storage (measured on one specific setup; results vary — details at the end)
1. IoT: line count is devices × metrics × frequency
Situation
Ten thousand sensors, reporting once a minute.
They’re stored long-format, one reading per line. Each device emits 100 metrics — temperature, humidity, voltage, current, and so on — as 100 separate lines per report, so a day comes to 10,000 × 1,440 × 100 = 1.44 billion lines. The lines are short, so it’s only tens of gigabytes; it’s the line count that goes up an order of magnitude.
The plant tells you “one unit in Building 3 was behaving strangely yesterday evening.” Nobody knows the device_id.
Why it happens
Machine logs are short lines in enormous numbers. Application logs written by people are the opposite — long lines, comparatively few of them. Same phrase, “huge log,” opposite shape.
Long format compounds it. Each line is just timestamp,device_id,metric,value, so reading one device’s state at one moment means reading 100 lines. Pivoting them side by side is possible, but that’s work you do after you know where the anomaly is.
And the way anomalies surface makes it worse. Averaging ten thousand devices buries the one faulty unit. Aggregation answers “is the fleet healthy”; it does not answer “which one.”
Working with general-purpose tools, and where it stops
The obvious approach is to narrow first, then look.
# Cut roughly by time (two hours of that evening)
grep -E '2026-09-11T1[6-7]:' sensor-20260911.csv > evening.csv

# Look at one metric
grep ',voltage,' evening.csv | head -50

# Pick off outliers mechanically (column 4 is the value)
awk -F, '$4+0 > 250 || $4+0 < 180' evening.csv | head

# Which device_id shows up most
awk -F, '$4+0 > 250 {print $2}' evening.csv | sort | uniq -c | sort -rn | head
When that lands, it’s fast. When it doesn’t, three limits show up.
First, you have to pick the threshold before you look. The example calls 180–250 normal, but that range is something you learn from the anomaly. The order is backwards. Guess wrong and you get either zero hits or several million — neither is useful.
Second, narrowing hides the neighbours. Pull only ,voltage, and the current and temperature readings from the same instant drop out of view. Device faults very often live in the relationship between metrics, and the filter severs exactly that. Adding ±N lines of context doesn’t fix it either: in long format, “the same device’s other metrics” aren’t necessarily adjacent lines.
Third, line numbers disappear. What line of the original is line 1 of evening.csv? When you want to tell the vendor “behaviour changes from this line,” you no longer have the coordinate (Part 16 covered exactly this cost of excerpting).
2. Medical: doing the first-pass triage in-house instead of handing it to the vendor
Situation
An analyser halts about once a week for no stated reason.
You contact the vendor; they ask for the logs; you send them; the answer comes a week later. The machine keeps halting in the meantime. The log exported from the device’s service mode is 12 GB.
Why it happens
Instrument logs are written on the assumption that only the people who built the instrument will read them.
- Internal codes. Lines like
E-1042orSUBSYS3 STATE=7. The meanings live only in the service manual. - Several subsystems in one stream. Control, transport, optics, and communications all write to the same file in time order. The lines are chronological; the context is per-subsystem (Part 5 covered the same shape with threads).
- Old encodings. Instruments from domestic manufacturers may still emit Shift_JIS, which breaks the moment a UTF-8-assuming tool opens it (Part 3).
- Export restrictions. If patient or examination identifiers are mixed in, you can’t simply upload the file to a cloud analysis service.
The real reason these investigations get handed off isn’t difficulty. It’s that nobody in the building has a tool that opens 12 GB. You can’t open it, so you can’t look; you can’t look, so the ticket says no more than “once a week, roughly in the evening”; thin information means more round trips. That’s the loop.
Working with general-purpose tools, and where it stops
This is about as far as you get on your own.
# Check the encoding before converting — never convert on a guess
file -i device.log
iconv -f CP932 -t UTF-8 device.log > device-utf8.log

# Which error codes appear, and how often
grep -oE 'E-[0-9]{4}' device-utf8.log | sort | uniq -c | sort -rn | head -20

# Cut out what surrounds the halt
grep -n -B 200 -A 20 'E-1042' device-utf8.log | head -100
Both file‘s detection and iconv‘s behaviour vary by implementation and version, so check your own man pages.
Three limits.
First, running iconv adds an intermediate file whose line numbers may not match the original. Instrument logs in particular may use CRLF endings, or pad the tail with null bytes.
Second, you can count occurrences but not order. uniq -c throws the sequence away, and instrument faults cascade — what you actually want is which subsystem broke first (Part 2 is the same problem).
Third, these logs become maintenance records. A fault investigation ends up supporting a service report. If all you kept is a processed copy, that support is weaker (Part 16).
3. Manufacturing: the PLC alarm history won’t open in the vendor’s own software
Situation
The line stopped. To find out why, you export the PLC’s alarm history.
Out comes a 3.8 GB CSV. The manufacturer’s own history viewer spins for a while and then reports that it is out of memory. The spreadsheet doesn’t even get that far — the 1,048,576-row ceiling means it can’t take the whole file in (Part 1).
Why it happens
Vendor software is built for the volume that machine was expected to produce.
The expectation usually breaks for one of these reasons:
- Contact chatter. Micro-vibration on a contact records the same alarm dozens of times per second, swelling the day to millions of lines.
- Line expansion. More points are collected than before, while the retention setting stays where it was years ago.
- Log everything. Somebody enabled all I/O points “so we won’t be stuck later,” and the alarm history quietly became a data logger.
On top of that, most vendor viewers read the entire file into memory before displaying anything. At 3.8 GB, installed RAM becomes the ceiling — and the machine on the floor is an office laptop that can’t be upgraded.
Two more wrinkles specific to the factory floor: alarm names are often Japanese in Shift_JIS, and bare CR line endings are still in service. With bare CR, what counts as “one line” changes from tool to tool, and line numbers stop agreeing.
Working with general-purpose tools, and where it stops
# Look at both ends first (column order and time range)
head -5 alarm.csv
tail -5 alarm.csv

# Collapse repeats to see which alarms, and how many
cut -d, -f3 alarm.csv | uniq -c | sort -rn | head -20

# Pull out what surrounds the stop
grep -n '2026/09/11 14:2' alarm.csv | head -40

# If nothing opens it, split it
split -l 500000 alarm.csv part_
Three limits.
First, split cuts the context. A cascade that crosses a boundary lands in two files, and each piece renumbers from 1, so the numbers no longer correspond to what the vendor viewer shows.
Second, collapsing the chatter erases the fact that there was chatter. uniq -c makes it readable, but “480 occurrences in ten seconds” is a case where the density itself is the symptom. Readability and evidential value pull in opposite directions.
Third, there’s no command line on that PC. Control-system machines frequently forbid installing anything. “Copy it to the analysis PC” means starting an export-approval process (Part 17 is about exactly that friction).
4. Research: look at the raw values before you plot them
Situation
A simulation ran for 48 hours and produced a 50 GB numeric log.
You load it and plot it, and part of the curve is suspiciously flat. A bug, a genuine physical result, or an output-side problem? The only way to tell is to look at the raw numbers.
Why it happens
Numeric logs break in ways that aggregation and plotting hide.
Four common forms:
NaNandinfslipping in. If the reader silently substitutes zero or a missing value, the plot simply looks flat.- Inconsistent notation.
1.0E-05,1.0e-05, and0.00001in the same file; some parsers quietly drop one form. - Column count changing mid-file. Around a restart or a checkpoint resume, the header may be written again, or a column may appear.
- A truncated tail. When a job is killed at the wall-clock limit, the final line ends mid-line.
Research logs also differ from operational logs in one decisive way: reproducing them takes 48 hours. “It was broken, so I’ll rerun it” is expensive, which makes it essential to check without disturbing the original (Part 13 is the same shape).
Working with general-purpose tools, and where it stops
# Did it finish cleanly? (look at the shape of the last line)
tail -3 sim-output.dat

# Where does NaN / inf start (line number of the first one)
grep -n -m 1 -E 'NaN|nan|inf' sim-output.dat

# Did the column count change partway through
awk '{print NF}' sim-output.dat | uniq -c

# Was the header written more than once
grep -c '^#' sim-output.dat
Three limits.
First, awk '{print NF}' scans all 50 GB. That’s minutes, during which you learn nothing. And the answer is only “the column count changed” — seeing where it changed means scanning again.
Second, grep -n gives you the line number but not the neighbourhood. Knowing there’s a NaN at line 1,203,884,112 doesn’t show you the 200 lines around it; for that you write a sed -n range and scan from the top again (Part 15 is where pipeline craft starts to hurt).
Third, the compute cluster and your analysis environment are different machines. Reading it in place with less over ssh means waiting a round trip for every screen. Pulling it local means transferring 50 GB and having room for it.
What all four had in common
| Field | What the log really is | Why the line count explodes | General-purpose approach | What’s left over |
|---|---|---|---|---|
| IoT sensors | Long-format time series, 4 columns | devices × metrics × frequency | grep by time and metric, awk for outliers |
Threshold must be chosen first. Filtering hides the neighbouring metrics |
| Medical devices | Internal codes, subsystems interleaved | Continuous operation, all subsystems in one file | iconv to convert, uniq -c to count |
Order is lost. Only a processed copy survives |
| Manufacturing PLC | Alarm history CSV | Contact chatter, expansion, log-everything | cut / uniq -c / split |
Splitting cuts the cascade. The density that is the symptom gets collapsed |
| Research simulation | Continuous numeric output | Long jobs × high output frequency | tail / grep -n / awk to inspect |
Minutes per scan. Reading around a hit means scanning again |
Four unrelated fields. They jam in the same place because machine-written logs share three properties:
- Line counts multiply. Raise devices, metrics, or frequency and it multiplies against the others, moving the order of magnitude. Logs people write grow by addition; these grow by multiplication.
- Anomalies are local. They don’t appear in the aggregate. They appear in one device, one minute, one line. Aggregation answers “healthy or not,” never “where.”
- The original can’t be damaged. Maintenance records in medicine, quality records in manufacturing, reproducibility in research, contractual retention in IoT. In all four there are moments when a processed copy isn’t enough.
With those three together, “narrow it down, then look” stops working as an order of operations. The filter depends on seeing the anomaly, and seeing the anomaly requires the filter. That’s the dead end shared by all four.
What’s needed is a tool that lets you reverse the order.
- Open the original, whole — look before narrowing. 1.44 billion lines, a 3.8 GB CSV, a 50 GB numeric dump, all the same.
- Narrow while looking — take a filtered result and filter it again, keeping the original line numbers the whole way down.
- Stay on this machine — patient identifiers, quality records, research data: none of it leaves.
Back to the 1.44 billion lines. That number doesn’t mean “too much to read.” It means you can’t throw away the other 1.44 billion until you’ve found the one device and the one minute.
The tool I use
UwView (free), which I develop, is a viewer that displays, scrolls, and searches huge text from the moment it opens. It never loads the whole file into memory, so it opens files larger than RAM. The index is built in the background; when it finishes, line numbers appear.
Of the three requirements above, the free version already covers the first and the third.
- How much you can read isn’t decided by RAM. An office laptop opens files of tens of gigabytes (measured ceiling on the free version: 47.73 GB, about 890 million lines — one specific setup). Section 3’s “out of memory” no longer has a premise.
- It never writes to the original, and never splits or excerpts it. No
splitfrom section 3, no intermediate files from section 4 — which means line numbers stay the original’s. The coordinate you give the vendor in section 1, the maintenance record in section 2, reproducibility in section 4: all of them rest on the original’s line numbers. - Everything runs on your own machine. The file is never sent anywhere. For section 2’s instrument logs containing patient data and section 3’s export approvals, that’s often a precondition rather than a nicety.
- Encoding can be switched while the file is open (UTF-8 / Shift-JIS (CP932) / EUC-JP / UTF-16, auto-detected). Sections 2 and 3’s Shift_JIS instrument logs open without an
iconvintermediate (Part 3). - Highlighting colours lines rather than removing them. Section 2’s interleaved subsystems can be untangled by eye with colour per subsystem, and because nothing is removed, the density stays visible — which is exactly what section 3’s chatter needs.
The second requirement — narrowing while looking — and the case of reopening the same log repeatedly are UwView Pro territory.
- Drill-down search: filter a result by another term, and another. The original line numbers survive to the last step. Section 1’s “narrow by time without a device_id, then by metric, then by magnitude” works without cutting the original (drill-down search).
- ±N is independent per step: ±1 while narrowing, ±200 while reading. Section 4’s “I have the NaN’s line number but have to scan again to read around it” disappears (the free version is fixed at ±1; a variable ±N is Pro).
- Sequence search: find only the places where
w1 → w2 → w3appear in that order. Section 2’s “which subsystem broke first” becomes a condition over the order of the codes (how it works). Honestly: each step scans the text from the previous position, so it takes about as long as a full-text search. - Tally (frequency ranking): counts per captured value, and clicking a row descends to where it occurred. It’s section 2’s
uniq -c, with the difference that you can get back to the actual lines after counting. - The index and the compression are saved: from the second open onward, the same file comes back instantly, with line numbers (0.02–0.07 s measured on a 47.73 GB text file; one setup, results vary). That’s what a line-stop investigation like section 3 needs, since the same history gets reopened for days.
- Stored at roughly 1/9 and still searchable: section 1’s 1.44 billion lines a day and section 4’s 50 GB output stay compressed and searchable, without
zgrep‘s decompress-as-you-scan on every query (Part 8). - Larger files: 258.68 GB and 4.5 billion lines measured on Pro (one specific setup; results vary).
The honest limits
UwView is a viewer. It is not a time-series analysis tool and not an analytics platform for data loggers.
- No statistics. Means, sums, standard deviations, moving averages — section 1’s outlier test and section 4’s sanity checks belong to
awkor your analysis environment. What this does is find the location of the anomaly fast, by eye. - No plotting. Section 4’s chart belongs to another tool. The premise of this article is checking the raw values before the plot.
- No pivoting from long to wide. Section 1’s reshape is out of scope.
- No understanding of CSV columns. Section 3’s alarm history is treated as text. “Show me only the third column” isn’t something it does.
- No decoding of instrument codes. The meaning of section 2’s
E-1042lives in the service manual. All this gives you is reading the order and context of those codes quickly. - No live tailing, no alerting, no automated cross-log correlation.
- Text only. Instruments that record in a binary format have to be exported to text first.
For completeness: non-destructive diff editing (Edit Upgrade) exists as a separate licence, but all four items above are read-only work. What you need here is the View side.
And if a huge log is eating your disk and you want it compressed for storage while staying searchable at speed, give UwView Pro a look — persistent index, compressed-cache search, and ~1/9 storage make both reopening and searching a step faster (all OS, one-time or monthly).
Links
- Part 1: four go-to tools that sink under huge files: https://uvp.y42u.net/en/blog/uwview-ps01-huge-file-tool-limits-en/
- Part 2: four techniques for tracing causality in logs: https://uvp.y42u.net/en/blog/uwview-ps02-log-causality-tracing-en/
- Part 3: four character-encoding traps and how to isolate them: https://uvp.y42u.net/en/blog/uwview-ps03-japanese-encoding-traps-en/
- Part 5: four practices for living with development logs: https://uvp.y42u.net/en/blog/uwview-ps05-debug-log-practices-en/
- Part 8: keeping logs compressed and still searchable: https://uvp.y42u.net/en/blog/uwview-ps08-compressed-archive-search-en/
- Part 13: four techniques for inspecting huge data: https://uvp.y42u.net/en/blog/uwview-ps13-huge-data-inspection-en/
- Part 15: four limits of command-line craft: https://uvp.y42u.net/en/blog/uwview-ps15-cli-craft-limits-en/
- Part 16: four principles for preserving, excerpting, and proving integrity: https://uvp.y42u.net/en/blog/uwview-ps16-log-as-evidence-en/
- Part 17: four points of friction between logs and your dev environment: https://uvp.y42u.net/en/blog/uwview-ps17-dev-env-log-friction-en/
- Drill-down search — narrowing a result by another term: https://uvp.y42u.net/en/blog/uvp-drilldown-search-en/
- Sequence search — finding only what appears in that order: https://uvp.y42u.net/en/blog/uvp-sequence-search-en/
- Source code (GitHub): https://github.com/amru195704/UwView
From the developer: a full list of my apps, Kindle books, and open-source work is on GitHub: amru195704.
A note
This article is provided for reference and makes no guarantee of accuracy or completeness. Fault investigation on medical devices and production equipment must follow each device’s manual and service documentation and the manufacturer’s instructions; nothing here is intended to replace vendor maintenance, only to support first-pass triage on site. Handling of patient data, quality records, and research data must follow your organisation’s policy and applicable law. Line counts, sizes, error codes, and filenames are illustrative and do not describe any real product or incident. The behaviour ofgrep,awk,cut,split,iconv,file,sort, anduniqvaries by implementation (GNU/BSD/busybox), version, and build options, as do option names and defaults — check your ownmanpages and the official documentation. Measured figures come from one specific setup and are not a guarantee of the same result. If you spot an error, a comment is welcome and I’ll check and correct it.