A build log, 480,000 lines.
One line in there explains the failure. What do you do before you reach for the scrollbar?
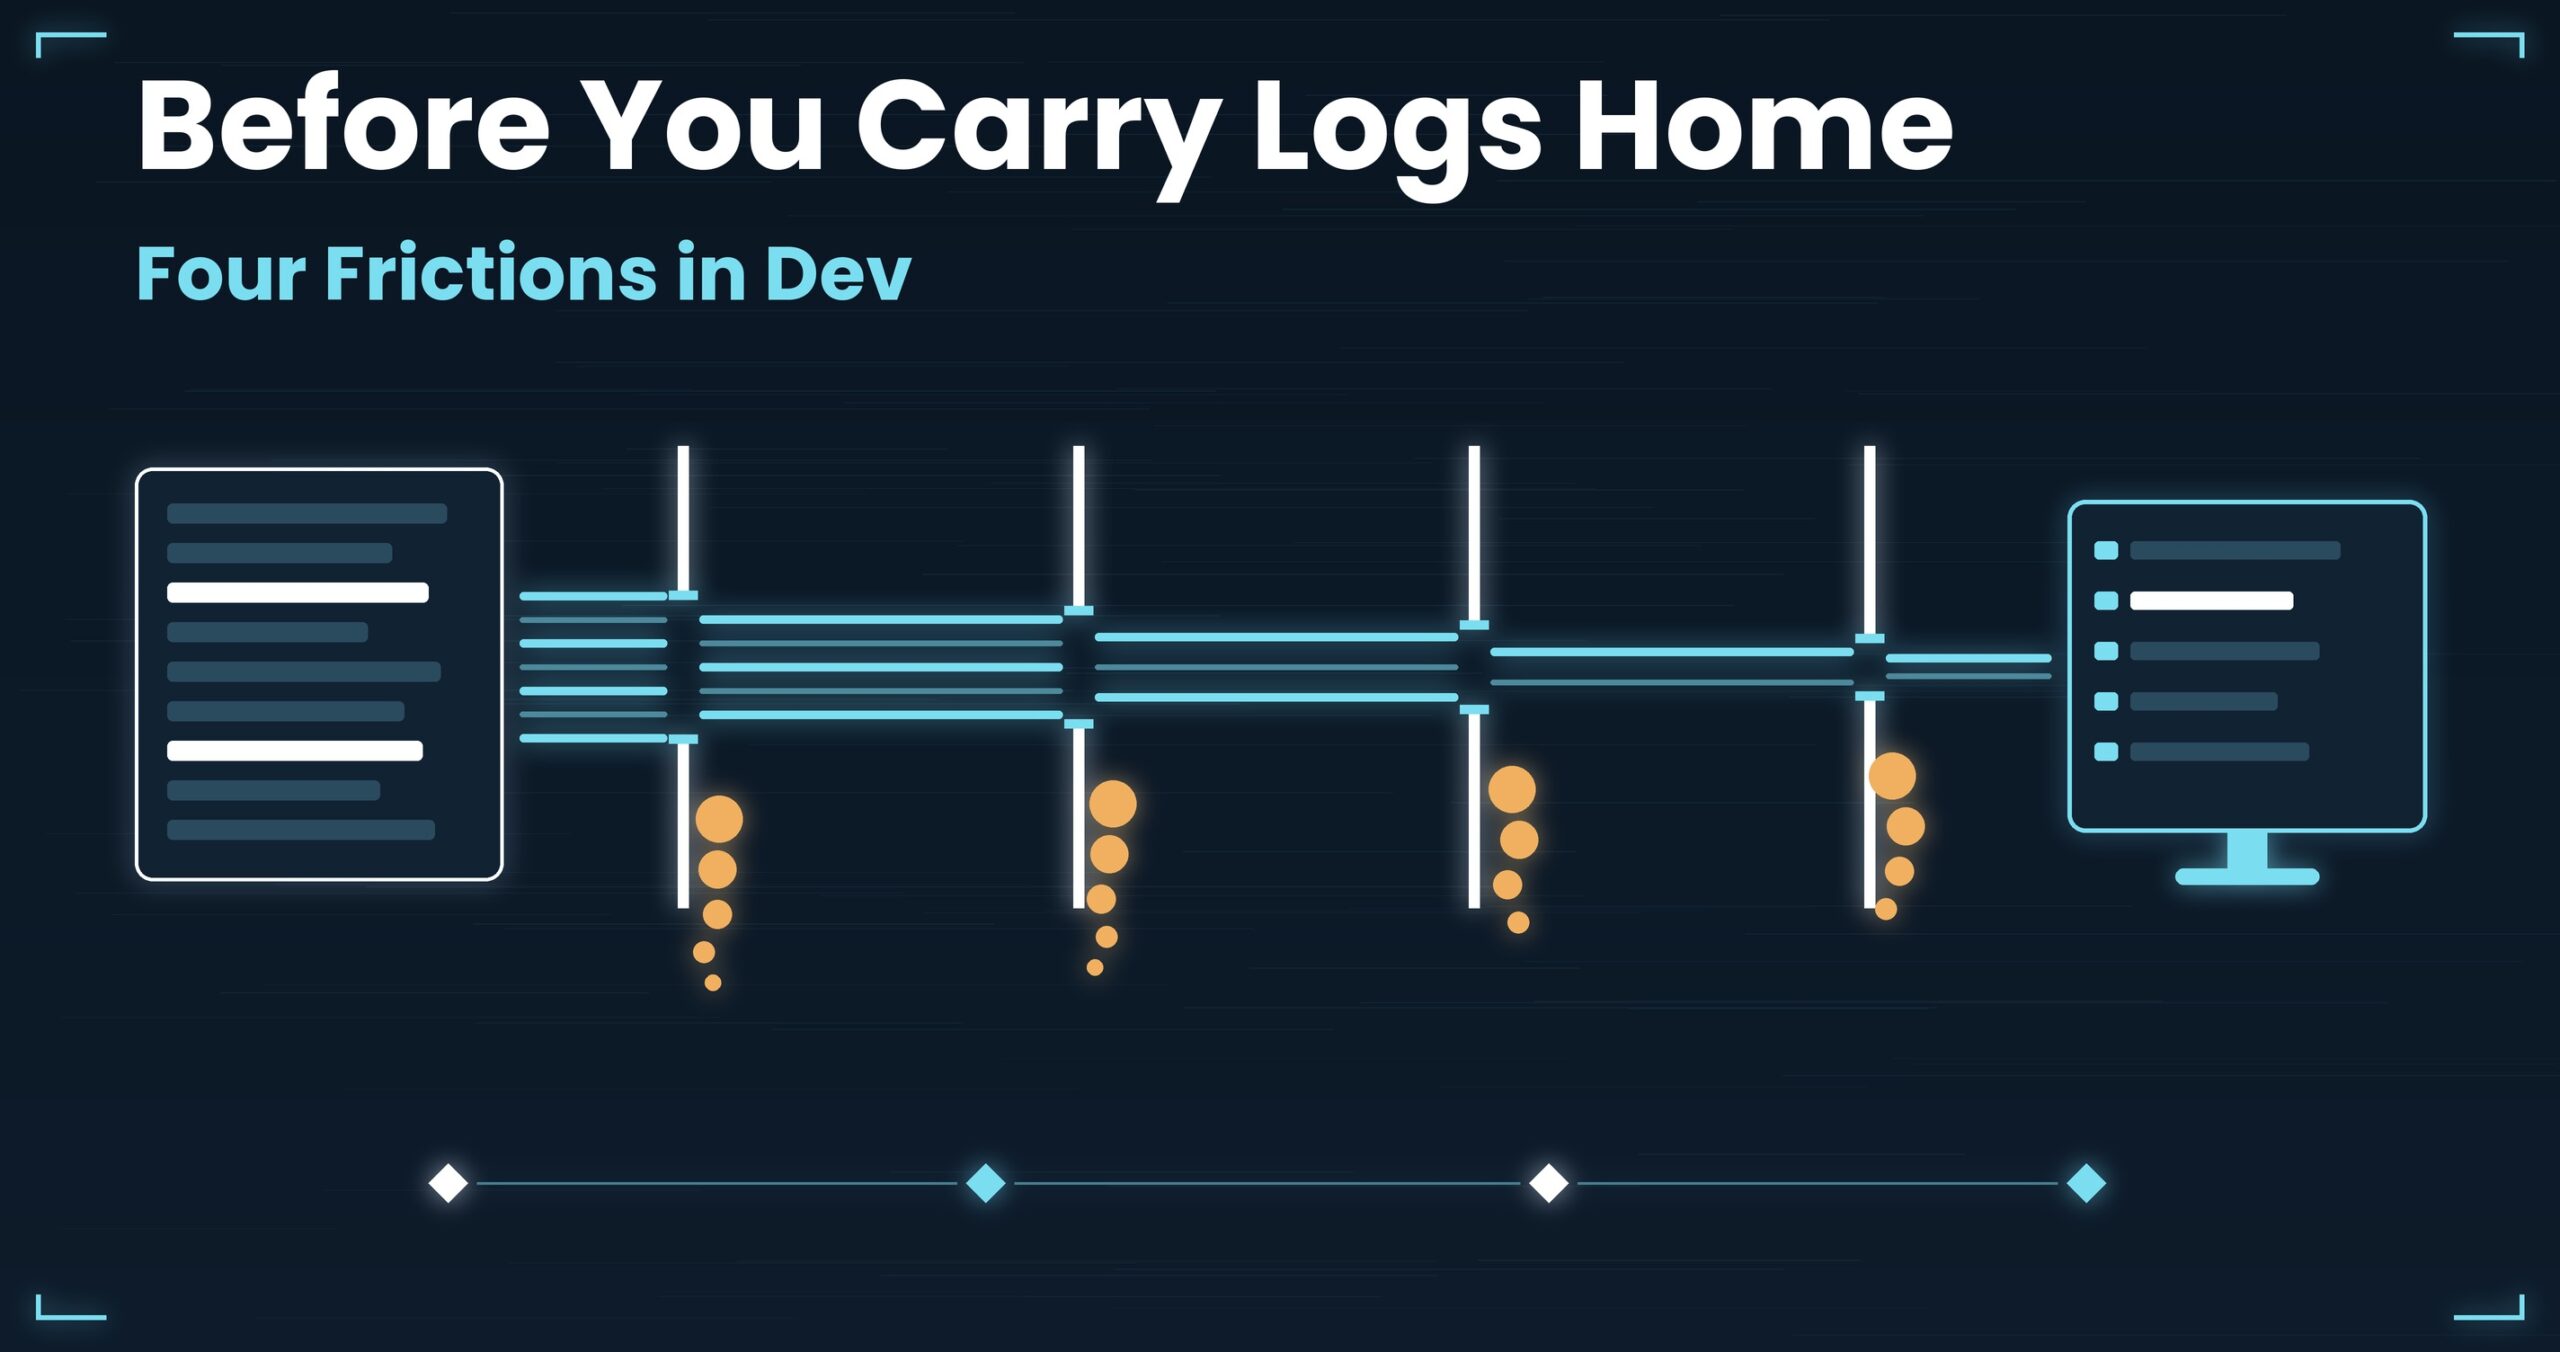
There are four places this gets stuck. All four happen when you bring a log into your own environment to read it.
CI build logs, the dump you carry home from production, file access across a WSL boundary, and the gap between one teammate’s machine and another’s. In none of these four cases is anything wrong with the log. What’s wrong is the path between the log and the person reading it.
- Up front: UwView opens a 480,000-line build log or an 80 GB dump without splitting it, and displays and searches it from the moment it opens. It never loads the whole file into memory, so how much you can read isn’t decided by how much RAM you have. Pro saves the index and the compression, so from the second open onward the same file comes back instantly, with line numbers (0.02–0.07 s measured on a 47.73 GB text file; one setup, results vary). Everything runs on your own machine — the file is never sent anywhere (details at the end)
- 1. The build log is too long to find the failure in
- 2. The bug only happens in production — and carrying the log home has two constraints at once
- 3. Reading 30 GB across a WSL boundary is ten times slower
- 4. “It opened fine on my machine”
- What the four had in common
- The tool I use
- Links
Up front: UwView opens a 480,000-line build log or an 80 GB dump without splitting it, and displays and searches it from the moment it opens. It never loads the whole file into memory, so how much you can read isn’t decided by how much RAM you have. Pro saves the index and the compression, so from the second open onward the same file comes back instantly, with line numbers (0.02–0.07 s measured on a 47.73 GB text file; one setup, results vary). Everything runs on your own machine — the file is never sent anywhere (details at the end)
1. The build log is too long to find the failure in
Situation
The pipeline goes red. You open the log in the browser. 480,000 lines.
Searching for ERROR gives 137 hits. The first one says dependency resolution failed, which is a result, not a cause. Scrolling on, you notice the same log appears three times. Retries.
Why it happens
CI logs aren’t written for humans to read. Four things stack up.
- Interleaved parallel jobs. Several jobs’ output lands in one stream. The lines are in time order; the context is not (Part 5 covered the same shape with threads).
- ANSI escapes. Colour control characters sit inside the text, so
grep 'ERROR'sometimes misses.[31mERRORdoes containERROR, but any regex that anchors on what comes before or after falls apart. - Progress bars. Output that overwrites itself with carriage returns becomes a single line of several megabytes in a file. That “480,000 lines” figure is already a lie.
- Retries. The same failure is recorded two or three times, and nothing on screen tells you which one came first.
On top of that, browser log viewers usually only hold part of the file in a virtual scroller. Ctrl+F reaches what has been loaded. “I searched and it wasn’t there” is not the same as “it isn’t there.”
Working with general-purpose tools, and where it stops
The basic move is to fetch the raw log and clean it up locally.
# 1) Pull the raw log with the CI's own CLI, bypassing the browser viewer
#    -> build-raw.log

# 2) Strip the colour control characters (ansi2txt from colorized-logs is easy)
ansi2txt < build-raw.log > build-plain.log

# 3) Expand carriage returns into newlines (progress-bar lines unfold)
tr '\r' '\n' < build-plain.log > build-lines.log

# 4) Look at only the first failure, with context
grep -n -m 1 -B 20 -A 5 -E 'ERROR|FAIL' build-lines.log
Command names and options vary by CI service and by implementation (GNU / BSD). If ansi2txt isn’t available, a sed or perl substitution does the same job — but how you write the escape character changes with the shell and the implementation, so check your own man pages.
Three limits.
First, every cleanup step produces another file. You end up with build-raw, build-plain, build-lines — and their line numbers no longer agree. When the CI UI says “line 12,345,” that’s a different line in the cleaned-up file.
Second, retention. Most services keep logs for a few weeks. The moment you want to check “I think it failed in the same place last month,” the comparison is gone.
Third, it’s still big afterwards. Expanding carriage returns multiplies the line count. Your editor stalls trying to open it — straight back to Part 1.
2. The bug only happens in production — and carrying the log home has two constraints at once
Situation
It doesn’t reproduce in dev, so you ask for the production log.
The estimate comes back: 80 GB. An hour to transfer, and you have 60 GB free on the SSD. Then ops mentions that the log contains personal data.
Why it happens
Two constraints of different kinds apply simultaneously — size and confidentiality — and each fix makes the other worse.
To solve size, you narrow or you split. But the filter you’d narrow by is only knowable after you’ve found the cause. You’re carrying the log home because you don’t know, yet you’re asked for the filter before you leave. That’s the ordering contradiction. In practice you grep out “just that day,” and later discover the answer was outside it.
To solve confidentiality, you mask — and masking is irreversible. Once email addresses are redacted, “I want to correlate two actions by the same person” is no longer possible. And a masking regex tends to fall one of two ways: it leaks, or it breaks. Leaking is a disclosure incident; breaking means the JSON no longer parses.
Working with general-purpose tools, and where it stops
# Transfer compressed (pre-compressing beats on-the-fly compression on a thin link)
gzip -c app.log > app.log.gz
# then move app.log.gz with whatever transfer you normally use

# If you narrow, keep the filter in the filename
grep -E '2026-09-1[01]' app.log > app-20260910-11.log

# Masking can't be made reversible; at least keep the original and mask a copy
sed -E 's/[A-Za-z0-9._%+-]+@[A-Za-z0-9.-]+/MASKED/g' app.log > app-masked.log
Three limits.
First, storing it compressed makes searching slow. 80 GB becomes 9 GB, but zgrep decompresses as it scans, every time (Part 8).
Second, splitting destroys the coordinate. Line 1 of a split fragment is line 1, and nothing tells you which line of the original it was. Part 16‘s “three things an excerpt breaks” applies here unchanged.
Third, and this is the real one: whether data may leave the building is a question about the path, not the size. Keeping a file local and reading it on your own machine is a different review from uploading it to a cloud log-analysis service. With a tool that works entirely locally, the question stops being “where do we send it” and becomes only “where do we put it.”
3. Reading 30 GB across a WSL boundary is ten times slower
Situation
You investigate a 30 GB log that lives on the Windows side, using grep inside WSL.
Something that takes two minutes on a Linux server hasn’t finished after twenty. The CPU is idle. The disk light is calm. You can’t see where the waiting happens.
Why it happens
File access that crosses an OS boundary pays a round trip per access.
In WSL2, the Windows drives you see from Linux are the Windows filesystem mounted over a protocol (9P by default). Each read becomes a round trip to the host side, so the more small reads a workload issues, the worse it does. The reverse direction — Windows tools reading files on the WSL side — has the same shape.
What matters here isn’t bytes transferred but number of accesses. Sequential scanners like grep read in larger chunks and fare relatively better; anything that reads back line by line, or bounces repeatedly around the tail of a file, slows down in proportion to how often it asks. WSL1 and WSL2 behave differently, and behaviour changes between versions.
Working with general-purpose tools, and where it stops
The most effective move is not crossing the boundary at all.
# WINLOG = path to the log on the Windows side, as WSL sees it

# Copy to the Linux-side native filesystem first, then work there
cp "$WINLOG" ~/work/app.log

# Or reduce what crosses the boundary (compress it first)
gzip -c "$WINLOG" > ~/work/app.log.gz
Mount options and metadata settings in WSL’s configuration file (wsl.conf) leave some room for improvement, but the effect is configuration-dependent.
Two limits.
First, the copy doubles your disk usage and takes time itself. You pay those minutes for 30 GB on every investigation.
Second, reading on the Windows side avoids the boundary — but then you have no tool. Notepad goes quiet at a few gigabytes (Part 1), and neither grep nor less ships as standard. So you go back to WSL. That round trip is the problem. Which means this isn’t a performance question but a placement question: which side of the boundary holds the tool.
4. “It opened fine on my machine”
Situation
A colleague you handed a 30 GB log to says it won’t open. It opened on your desktop.
The difference is 64 GB of RAM versus 16. The result: log investigation collects around the one person with the memory. While they’re on leave, the investigation stops.
Why it happens
If your tool assumes it will read everything into memory, your ceiling is your RAM. When the ceiling differs per machine, the team’s capability doesn’t settle at the weakest machine — it becomes dependent on the one person with the strongest.
There’s a second effect: when tools differ, the vocabulary stops being shared. “Look at line 12,034,541” shows a different line if the other person’s tool counts \r as a line break. BOMs, UTF-16, and line-ending conventions all shift the numbering too (Part 3, Part 11). Line numbers get used as a shared language, but they aren’t one unless the tools agree.
Working with general-purpose tools, and where it stops
The standard answer is that everybody sshes to a shared box and reads with less. The log never leaves, and the environment gap disappears.
Three limits.
First, latency. Every repaint waits for a round trip, which is poor for the kind of investigation you do with your eyes. Remote work makes it heavier still.
Second, nothing persists. Colours, bookmarks, search terms — close less and they’re gone. The unit of handover becomes a verbal explanation (the same problem behind the resumption point in Part 13).
Third, everyone queues on one machine. Two people scanning tens of gigabytes at once fight over that box’s I/O.
So the conclusion: levelling the environment doesn’t mean levelling the RAM — it means agreeing on a tool that doesn’t depend on RAM. If a 16 GB laptop opens it, everyone sees the same line numbers, and the work stops pooling on one person.
What the four had in common
| Friction | Where it stalls | Direct cause | General-purpose approach | What’s left over |
|---|---|---|---|---|
| CI build log | The browser viewer | Interleaving, ANSI, progress bars, retries | Fetch the raw log, clean with ansi2txt / tr |
Line numbers shift with each pass; still huge afterwards |
| Carrying production home | Transfer and review | Size and confidentiality at once | Compressed transfer, grep to narrow, masking |
The filter is only knowable afterwards; masking is irreversible |
| Reading across WSL | The OS boundary | One round trip per access | cp to the native filesystem first |
Double the disk, plus copy time; no tool on the Windows side |
| Team environment gap | The reader’s machine | The ceiling is set by RAM | ssh to a shared box, read with less |
Latency; nothing persists; everyone on one machine |
All four push you into the same choice: transform the log before reading it, or travel to where the log lives. Transform it and the line numbers change. Travel to it and nothing you learn persists.
Which makes the requirements three.
- How much you can read isn’t set by RAM. Satisfy this and section 4’s gap simply stops existing — and sections 1 and 2 no longer need “shrink it so it fits.”
- You can read the original as it is. Opened without splitting, masking, or cleanup, so section 2’s irreversible decisions can be postponed.
- It completes locally. Section 2’s review question changes from “where do we send it” to “where do we keep it,” and section 3 reduces to where the file sits.
Back to the 480,000 lines. That log was never too long to read. It was a log you had to transform before reading — which cost you the only coordinate it had.
The tool I use
UwView (free), which I develop, displays, scrolls, and searches huge text from the moment it opens. It doesn’t load the whole file into memory, so files larger than RAM open fine. The index builds in the background, and line numbers appear when it finishes.
Of the three requirements above, the free version covers the first two outright.
- How much you can read isn’t set by RAM. A 16 GB laptop opens files of tens of gigabytes (47.73 GB / about 890 million lines measured on the free version; one specific setup). The precondition for section 4’s “it opened on my machine” disappears.
- It never writes to the original, and never splits or extracts. Section 1’s cleanup intermediates aren’t needed, so the line numbers still match the CI UI. Section 2’s “just narrow it for now” can wait.
- The same tool runs on Windows, macOS, and Linux. That makes section 3’s “which side holds the tool” a choice. Read a Windows-side log with a Windows-side tool and no round trips cross the boundary.
- All processing is local. The file is never transmitted anywhere. In section 2’s review, that is sometimes the precondition rather than a feature.
- Encoding switches while the file stays open (UTF-8 / Shift-JIS(CP932) / EUC-JP / UTF-16, auto-detected). No
iconvintermediate (Part 3). - Highlighting colours lines rather than removing them. Section 1’s interleaving can be untangled by eye, colouring per job name (Part 5).
The third requirement — and every case where you reopen the same file — is UwView Pro‘s territory.
- It saves the index and the compression: from the second open onward the file comes back instantly, with line numbers (0.02–0.07 s measured on a 47.73 GB text file; one setup, results vary). The dump you carried home in section 2 gets reopened the day you write the report, the day review sends it back, and the day something similar recurs — the same tens of gigabytes, across days.
- ~1/9 storage, still searchable: aimed straight at section 2’s “it won’t fit on my SSD.” Search goes through the compressed cache, so there’s no
zgrep-style decompress-as-you-scan on every query (Part 8). - Drill-down search: narrow a result by another term, then another, and the original line numbers survive to the last stage. Against section 2’s “the filter is only knowable afterwards,” this answers by narrowing the view instead of narrowing the file (implementation write-up).
- ±N is independent per stage: ±1 while narrowing, ±20 on the stage you read. Section 1’s “discover
-B 20was too small, then rungrepagain” disappears (free version is fixed ±1; variable ±N is Pro). - Sequence search: match only where
w1 → w2 → w3appear in that order. In section 1’s log, where a retry recorded the same failure three times, the ordering of the first occurrence becomes the query (implementation write-up). One honest note: each stage scans the body from the previous stage’s position, so it takes about as long as a full-text search. - Search terms and colour rules can be saved and handed over: aimed at section 4’s “close
lessand it’s gone” (archive plus session restore).
The honest limits
UwView is a viewer. It is not CI log infrastructure and not a log-aggregation service.
- It doesn’t strip section 1’s ANSI escapes or fold progress bars. If preprocessing is needed,
sedandtrare your job. - It doesn’t fetch logs from a CI API either. You still need the CI’s own CLI or equivalent.
- It doesn’t mask anything. Handling personal data follows your organisation’s policy.
- Section 3’s I/O penalty cannot be removed by a tool. It’s solved by placement — which side of the boundary the file sits on, and which side’s tool reads it.
- No live tailing, no alerting, no automated cross-log correlation.
- Text only. Binary dumps and core dumps are out of scope.
For completeness: non-destructive diff editing (Edit Upgrade) exists as a separate licence, but all four items above are read-only work. What you need here is the View side.
And if a huge log is eating your disk and you want it compressed for storage while staying searchable at speed, give UwView Pro a look — persistent index, compressed-cache search, and ~1/9 storage make both reopening and searching a step faster (all OS, one-time or monthly).
Links
- Part 1: four go-to tools that sink under huge files: https://uvp.y42u.net/en/blog/uwview-ps01-huge-file-tool-limits-en/
- Part 3: four character-encoding traps and how to isolate them: https://uvp.y42u.net/en/blog/uwview-ps03-japanese-encoding-traps-en/
- Part 5: four practices for living with development logs: https://uvp.y42u.net/en/blog/uwview-ps05-debug-log-practices-en/
- Part 8: keeping logs compressed and still searchable: https://uvp.y42u.net/en/blog/uwview-ps08-compressed-archive-search-en/
- Part 11: reading legacy encodings in 2026: https://uvp.y42u.net/en/blog/uwview-ps11-legacy-encoding-euc-utf16-en/
- Part 13: four techniques for inspecting huge data: https://uvp.y42u.net/en/blog/uwview-ps13-huge-data-inspection-en/
- Part 15: four limits of command-line craft: https://uvp.y42u.net/en/blog/uwview-ps15-cli-craft-limits-en/
- Part 16: four principles for preserving, excerpting, and proving integrity: https://uvp.y42u.net/en/blog/uwview-ps16-log-as-evidence-en/
- Drill-down search — narrowing a result by another term: https://uvp.y42u.net/en/blog/uvp-drilldown-search-en/
- Sequence search — finding only what appears in that order: https://uvp.y42u.net/en/blog/uvp-sequence-search-en/
- Archive plus session restore, as a working flow: https://uvp.y42u.net/en/blog/uwview-archive-session-restore-workflow-en/
- Source code (GitHub): https://github.com/amru195704/UwView
From the developer: a full list of my apps, Kindle books, and open-source work is on GitHub: amru195704.
A note
This article is provided for reference and makes no guarantee of accuracy or completeness. Moving production data, masking personal information, and retaining logs must follow your organisation’s policy and applicable law. Line counts, sizes, and filenames are illustrative and do not describe any real case. The behaviour ofsed,tr,grep,gzip, andcpvaries by implementation (GNU/BSD/busybox), version, and build options, and CI service CLIs and retention periods change with the vendor’s specifications. WSL file-access performance varies substantially with version (WSL1/WSL2), Windows build, mount settings, and whether antivirus is active, so the description here explains a tendency rather than guaranteeing any figure. Check option names and defaults against your ownmanpages and the official documentation. Measured figures come from one specific setup and are not a guarantee of the same result. If you spot an error, a comment is welcome and I’ll check and correct it.